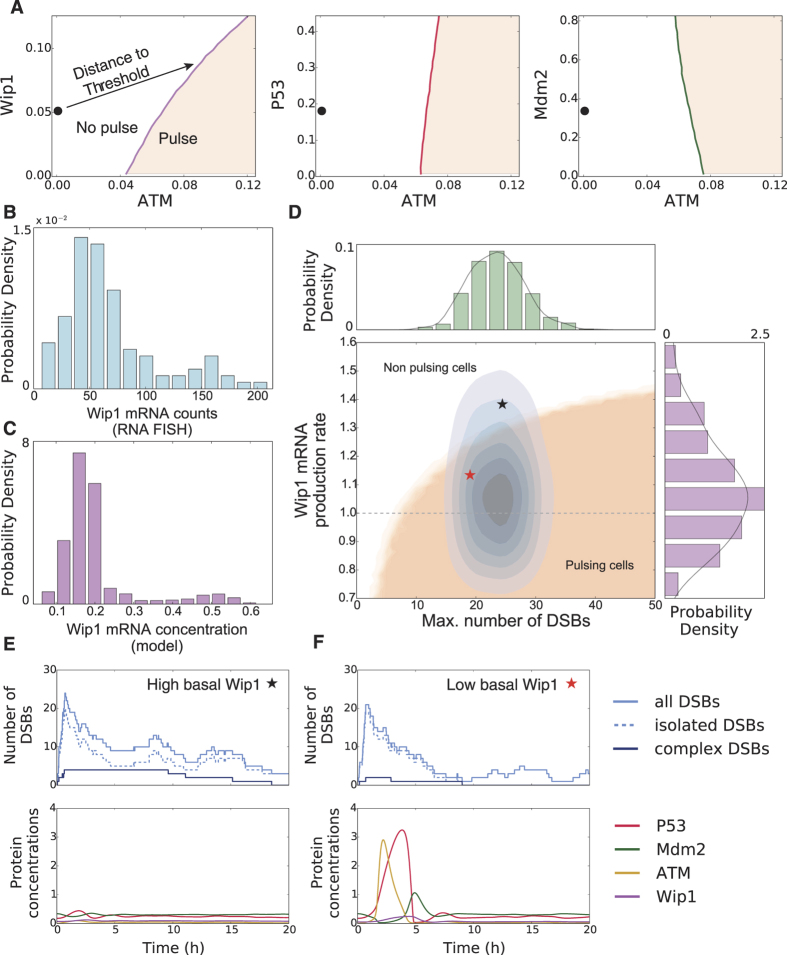
Figure 4. The responsiveness of individual cells towards damage is modulated by Wip1 levels.
(A) Sensitivity of the excitation threshold for fluctuations of the three regulated proteins p53, Mdm2 and Wip1. The steady state is depicted as (•) for basal activated ATM levels on the left respectively. The p53 system is particularly sensitive to Wip1 fluctuations, as it influences the threshold the most. (B) Measured single cell Wip1 mRNA counts for an unstimulated cell population (N = 106). (C) Modeled in silico Wip1 mRNA concentration variability. The single cell expression levels were drawn from a log-normal distribution and the system was driven by basal DSB dynamics. (D–F) The dependency of p53 responsiveness on damage levels (maximal number of inflicted DSBs) and Wip1 expression rate is shown in D. Cells responding with a p53 pulse lie inside the beige area. A typical fixed dose experiment will induce a distribution of cells inside this plane (blue contours), as both the number of DSBs and the Wip1 expression levels are variable on the single cell level. The fraction of cells within the beige area determines the population response. Exemplary simulations of cells with high (E, black star) or low (F, red star) Wip1 are shown. Although both cells suffered comparable numbers of DSBs, only the cell with low Wip1 level was responsive.

