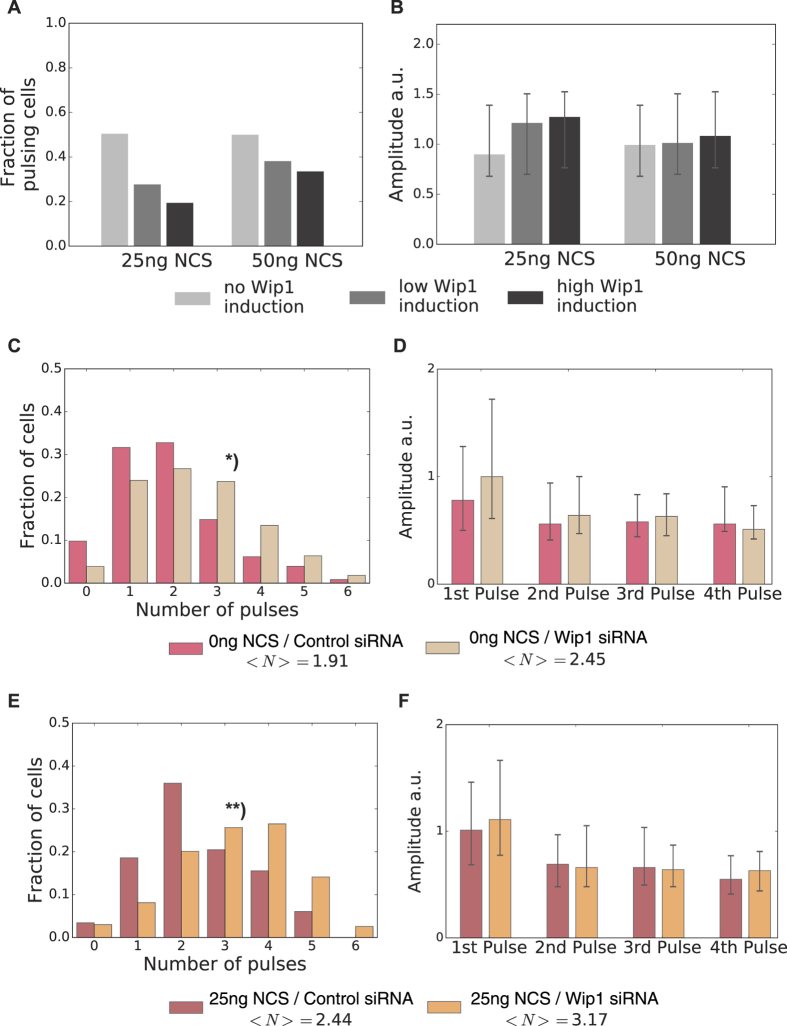
Figure 5. Experimental verification of threshold modification by Wip1.
(A) Measured fraction of A549 reporter cells showing a pulse in the first six hours for two different damage doses and three different levels of Wip1 overexpression as indicated. Higher Wip1 levels reduced responsiveness in vivo. (B) Median pulse amplitudes of the responding cells shown in A, error bars indicate the 1st and 3rd quartile respectively. (C) Fraction of undamaged A549 reporter cells transfected with scrambled control or Wip1-targeting siRNA for 72 h showing the indicated number of pulses in 24 h. Lower levels of Wip1 lead to more frequent occurrence of isolated p53 pulses in basal conditions*): Kolmogorov-Smirnov test - p-value = 3,71 10−7. (D) Median pulse amplitudes for cells shown in C, error bars indicate the 1st and 3rd quartile respectively. (E) Fraction of A549 reporter cells transfected with scrambled control or Wip1-targeting siRNA for 72 h showing the indicated number of pulses in 24 h after treatment with 25 ng/ml NCS. When Wip1 expression is reduced, cells respond with more p53 pulses to damage induction. **): Kolmogorov-Smirnov test – p-value = 2,54 10−8. (F) Median pulse amplitudes for cells shown in E, error bars indicate the 1st and 3rd quartile respectively.

