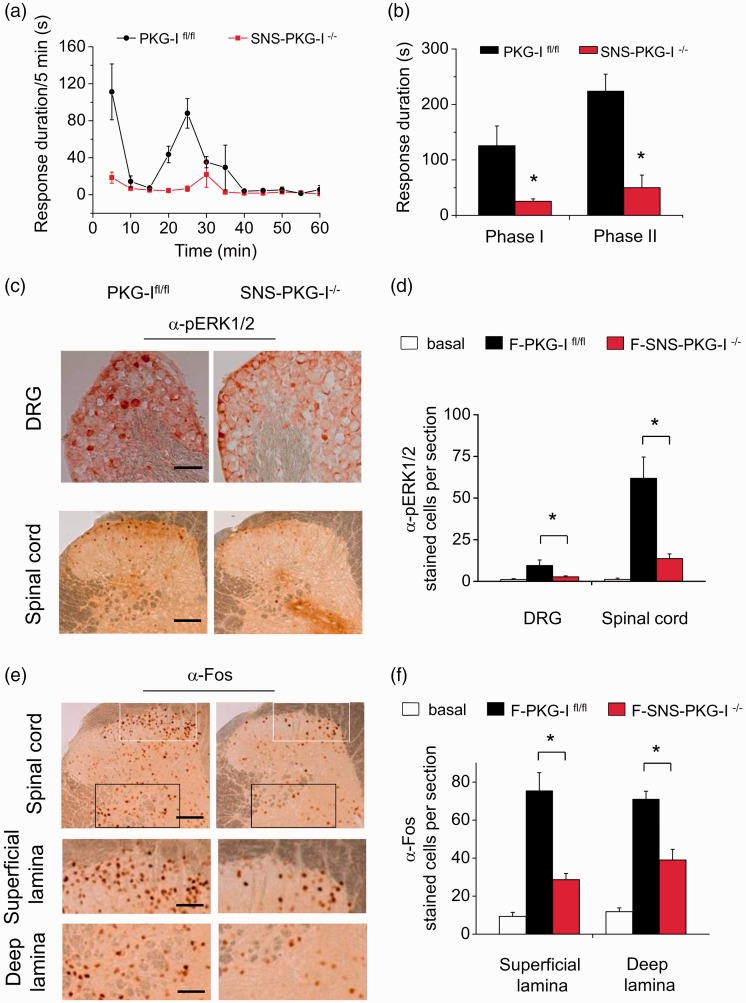
Figure 3.
Time course (a) and quantification analysis (b) showing that SNS-PKG-I−/− mice displayed a significant reduction of formalin-induced spontaneous pain responses in both phases as compared to PKG-Ifl/fl mice. (c) Typical examples showing that phosphorylated ERK1/2 (pERK1/2) immunoreactivity was induced in the DRG (upper panels) and spinal cord (lower panels) at 1 h following intraplantar injection of formalin in PKG-Ifl/fl mice and SNS-PKG-I−/− mice. (d) Quantitative summary of the number of pERK1/2-positive cells in the DRG and spinal cord derived from control and formalin-treated mice. (e) Typical examples showing that c-Fos immunoreactivity was induced in both the superficial and deep lamina of the spinal cord at 1 h following intraplantar injection of formalin in PKG-Ifl/fl mice and SNS-PKG-I−/− mice (upper panels). Magnification of superficial (middle panels) and deep lamina (lower panels) are shown. (f) Quantitative summary of the number of c-Fos-positive cells in both the superficial and deep lamina of spinal cord derived from control and formalin-treated mice. * indicates statistically significant differences (P < 0.05) between PKG-Ifl/fl mice and SNS-PKG-I−/− mice (ANOVA, post hoc Fisher’s test, n = 4 mice per genotype). Scale bars represent 100 µm in (c) and upper panels in (e), 50 µm in middle and lower panels in (e).

