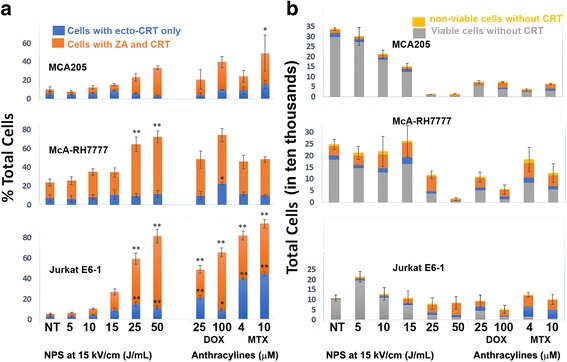
Fig. 4.

Ecto-calreticulin (CRT) detected by flow cytometry on three different cell lines 24 h after treatment with NPS, doxorubicin (DOX) or mitoxantrone (MTX). a Percent of total cells expressing ecto-CRT. Blue bars indicate viable cells labeled with CRT that did not label with Zombie Aqua (ZA). Orange bars indicate cells that labeled with both ZA and CRT and yellow indicates non-viable cells without CRT. Significant difference from untreated controls by one-way ANOVA with between group analysis performed using the Dunnett’s test. *p < 0.05; **p < 0.01. b Total cells detected by flow cytometry in four classifications; Blue represents those viable cells with ecto-CRT; grey indicates viable cells without ecto-CRT; Orange indicates non-viable cells with CRT and yellow indicates non-viable cells without CRT
