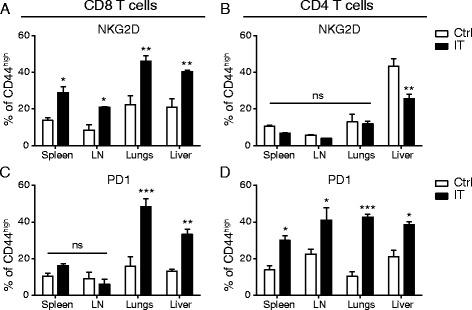
Fig. 4.

Differential expression of activation and inhibitory markers in CD8 T cells dependent upon location. Mice were treated with anti-CD40/IL-2 immunotherapy and assessed for various immune parameters on day 12 of treatment in lymphoid (spleen or LN) or peripheral (lungs or liver) organs. Percentage NKG2D+ (a-b) and PD-1+ (c-d) of CD8 (a, c) and CD4 (Foxp3-ve) (b, d) T cells across various organs. Pie graphs depicting CD8 EM/CM of each organ under given treatment conditions/organ. These data are representative of 2-4 independent experiments with 3 mice per group. Data are presented as mean ± SEM. Statistics were derived using ANOVA with Bonferroni’s post-test, *P < 0.05, **P < 0.01, ***P < 0.001
