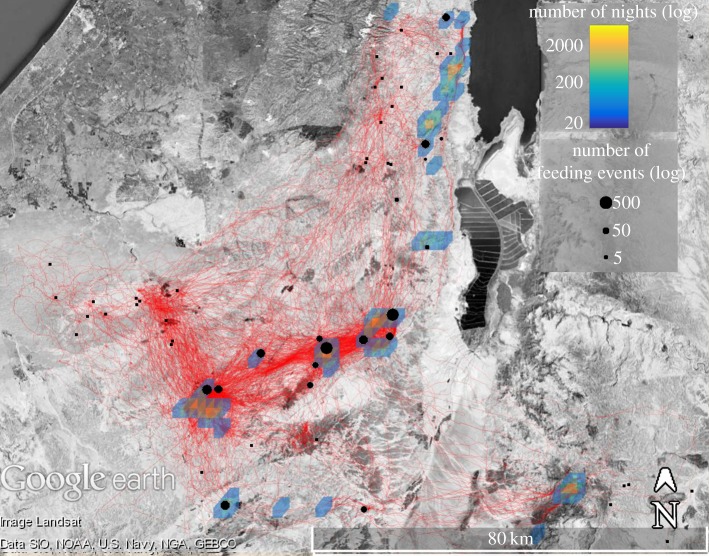
Figure 1.
A map of the study area with the feeding stations (black circles; size reflect visits of GPS-tagged vultures to each of the stations; log scale), non-station feeding events (black squares), roosting sites (density plot of the sites with more than 20 vulture-nights during the study period with a grid of 2 × 2 km; log scale), and a sample of the foraging tracks (red lines). The distribution of carcasses among feeding stations forces vultures to actively search for currently available food resources.

