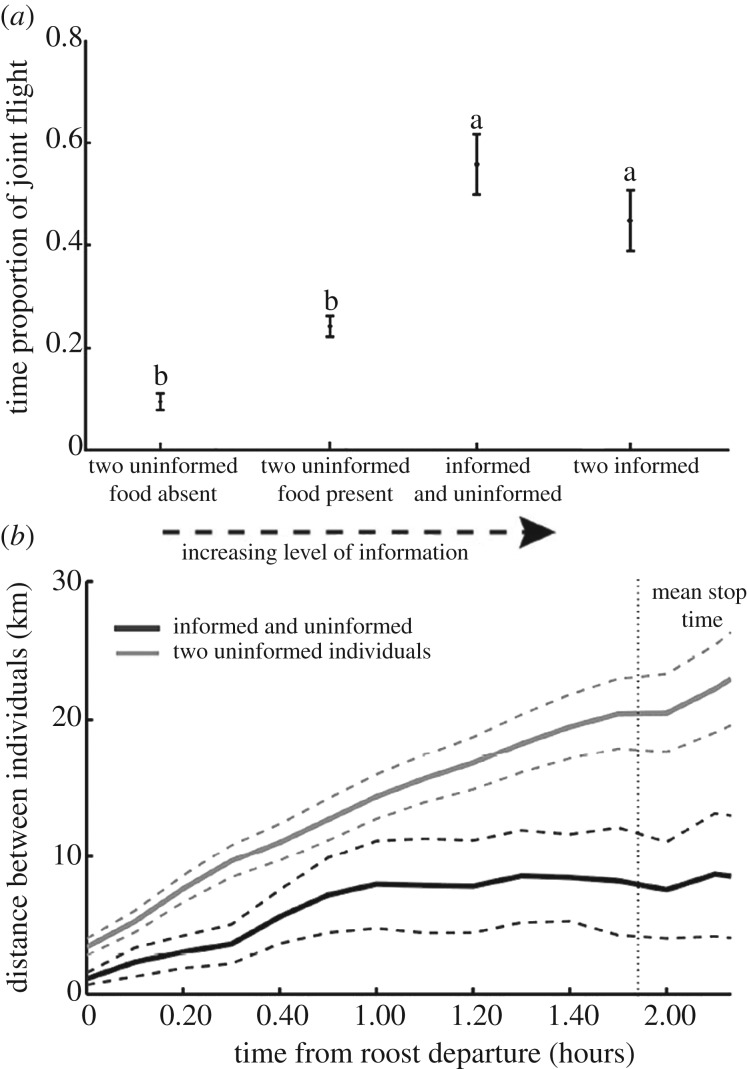
Figure 3.
Joint flight and ‘following behaviour’ during dyad flights. (a) Mean proportion of joint flight (defined as two birds being within a detection range of 4 km) for four dyad types, representing a gradient of increasing information about location of available resources. (b) Mean distance between dyads of birds differed markedly in the presence (dark grey) and absence (light grey) of an informed individual in the dyad. The dotted vertical line marks the average track duration until the first stop. Mean and CI are presented in both panels. Letters represent significant differences between dyad types. See the electronic supplementary material for statistical modelling.

