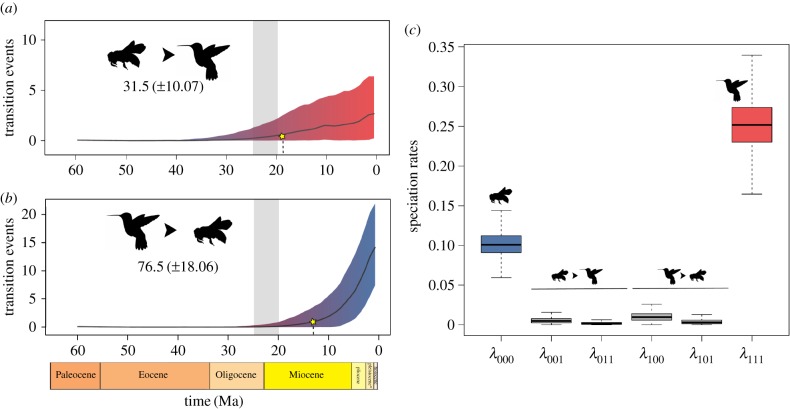
Figure 2.
(a,b) Estimated number of transitions through time for pollination syndromes. Numbers below the pictograms correspond to the mean total number of transitions between the states and the standard deviation. Stars denote the starting point in time where at least one transition is recorded in 95% of the reconstructions. Grey bar is the age of the most recent CA of extant hummingbirds (20.3–24.7 Ma [28]). (c) State-dependent speciation rate estimates from ClaSSE model. λ = speciation rate (specific parameters in Diversification analysis section), 0 = insect, 1 = hummingbird. Colours and pictograms correspond to the binary pollination syndrome: blue for insect, and red for hummingbird states.

