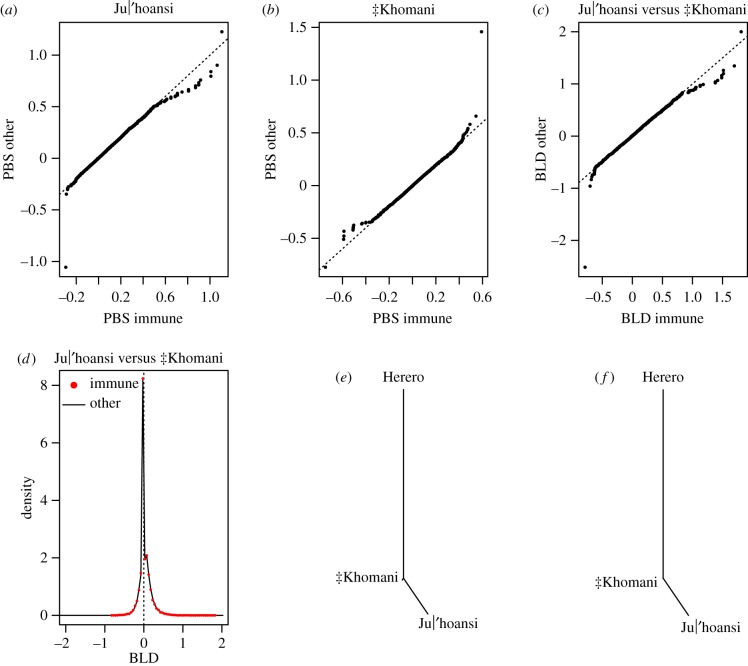
Figure 3.
PBS and BLD analysis for Ju|'hoansi versus ‡Khomani (p-values based on Mann–Whitney U-test) (a) qq plot of PBS values for SNPs in immune genes (n = 19 737, x-axis) and SNPs in all genes (n = 627 769, y-axis) in Ju|'hoansi (mean PBS = 0.0289 among SNPs in immune genes and mean PBS = 0.0300 among SNPs in other genes, p = 0.00997), (b) qq plot of PBS values for SNPs in immune genes (x-axis) and SNPs in all genes (y-axis) in ‡Khomani (mean PBS = 0.00147 among SNPs in immune genes and mean PBS = 0.00017 among SNPs in other genes, p = 0.0023), (c) qq-plot for BLD values of SNPs in immune genes (x-axis) and SNPs in all genes (y-axis) in Ju|'hoansi versus ‡Khomani (mean BLD = 0.0274 among SNPs in immune genes and mean BLD = 0.0298 among SNPs in other genes, p = 0.00527), (d) distribution of BLD at SNPs in immune genes (red) and at SNPs in all genes (black), (e) tree representation of PBS values for SNPs in immune genes, and (f) tree representation of PBS values for SNPs in other genes. (Online version in colour.)

