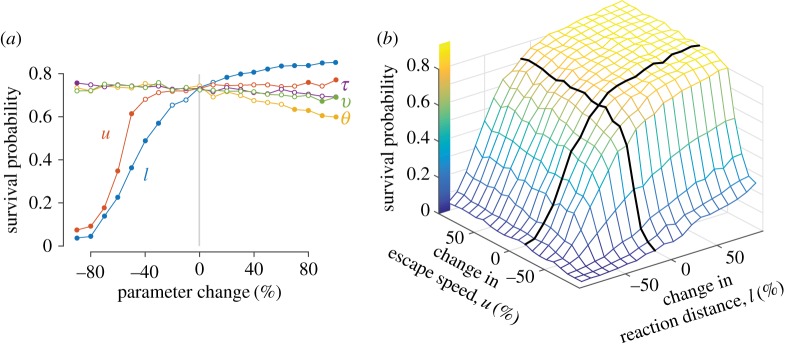
Figure 4.
Parameter analysis of the mathematical model to examine the effects on escape probability. (a) We individually varied the mean of a parameter among simulations by manipulating its probability distribution (figure 2, see table 1 for parameter definitions and values). Each point represents the survival probability of prey among 1000 simulations and filled circles denote a significant difference (KS-test: p < 0.05) from the observed probability. Simulations that varied in escape angle (θ) differed by a interval of 0.127 rad. (b) Variation in escape probability was examined with respect to both escape speed and reaction distance. All simulations shown here used an adult predator, although similar results were obtained with a juvenile predator (electronic supplementary material, figure S2).

