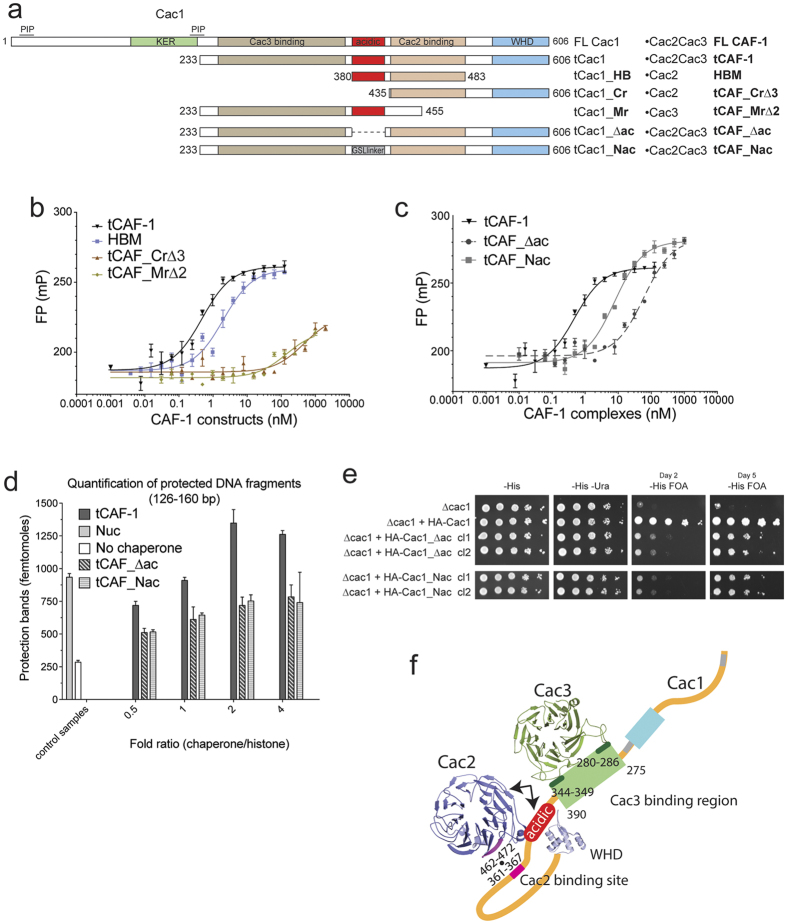
Figure 4. CAF1 binds histones H3-H4 through a composite interface.
(a) Schematic overview of the constructs used to validate histone binding and deposition mechanism. Summary of the binding affinity and the activities measured for each complex. WHD: winged-helix domain. KER : KER-rich (highly charged, pI = 9.89) domain. PIP: PCNA interaction peptide. HBM: histone binding module. Cr: C-terminal region of Cac1. Mr: middle region of Cac1. ∆ac: tCac1 with deleted acidic region. Nac: tCac1 with neutralized acidic region. (b) Affinity measurements (fluorescence polarization) of CAF-1 subunits and sub-complexes described in Fig. 4a, to H3-H4 labeled with Alexa488. Values are reported in Table 1. (c) Affinity measurements (fluorescence polarization) of tCAF-1, tCAF_∆ac and tCAF_Nac, to H3-H4 labeled with Alexa488. Values are reported in Table 1. (d) Quantification of the nucleosome bands (126–160 bp) from the NAQ assays of tCAF-1, tCAF_∆ac and tCAF_Nac. The nucleosome assembly reactions on 207 bp DNA were treated with MNase. The DNA was then purified and quantified from Bioanalyzer runs. Mean ± SEM is shown of at least two independent experiments. (e) Silencing assay performed with yeast strains expressing the Cac1 mutations at the acidic region. Samples were spotted at 0-101-102-103-104 dilutions from a OD600 = 1 stock. (f) A yeast CAF-1 model showing the interfaces between the 3 subunits. Histone binding occurs through a composite histone binding interface on CAF-1, including the acidic region of Cac1 and Cac2 (arrows). Data from SEC-SAXS and HX-MS were used to build this structural model. The Cac2 and Cac3 homology models were generated using Phyre2.

