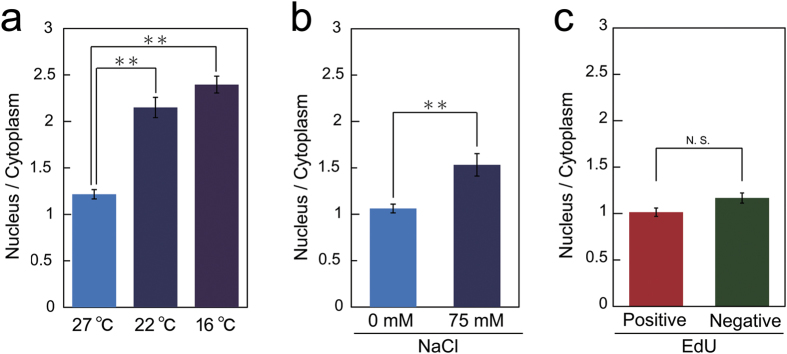
Figure 4. Monitoring of H3K9ac in response to environmental stresses.
(a,b) Quantitative analysis of H3K9ac levels in tobacco BY-2 cells treated with cold stress for 3 h (a) or NaCl for 6 h (b). The ratio of nuclear/cytoplasmic intensity of H3K9ac-mintbody-GFP is shown. The values represent means ± S.D. (n = 16–19, t-test; **p < 0.01). (c) Quantitative analysis of H3K9ac levels during the cell cycle in tobacco BY-2 cells. Cell cycle stages were distinguished by the pulse EdU incorporation. The ratio of nuclear/cytoplasmic intensity of H3K9ac-mintbody-GFP is shown. The values represent means ± S.D. (n = 16–28, N.S., not significant by t-test).

