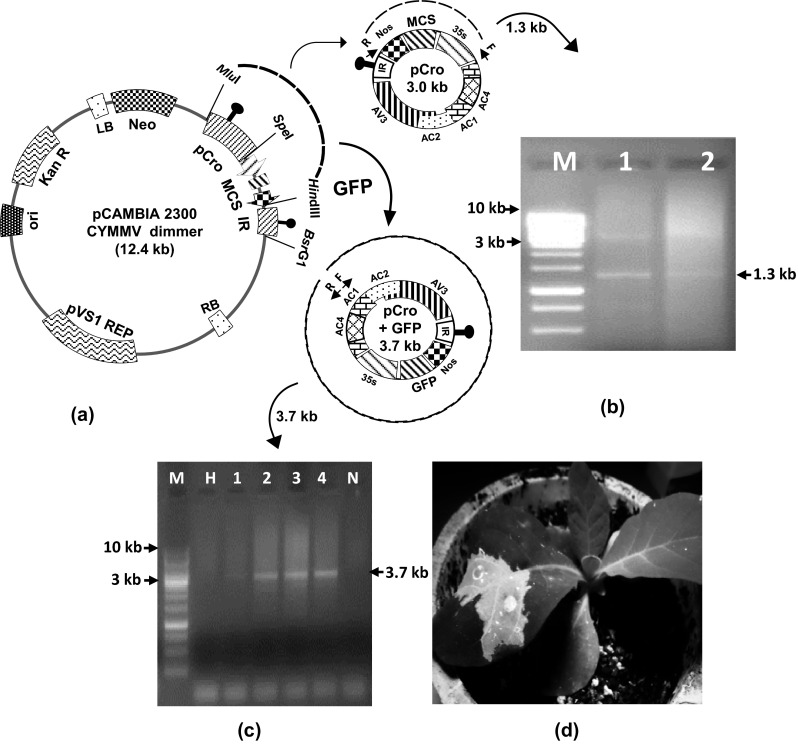
Fig. 5.

Expression of GFP in N. tabacum plant using pCro vector. a Schematic representation of episomal release of pCro and pCro-GFP from binary vector backbone. Inverse primer positions are indicated as small arrows within the episomal fragments, b detection of pCro episome from agroinoculated plants by inverse-PCR which yielded a 1.3 kb amplicon, c detection of pCro-GFP episome from agroinoculated plants by PCR which yielded a 3.7 kb amplicon. M 1 kb ladder, N negative control, H healthy control; d epifluorescence of GFP from N. tabacum under UV light
