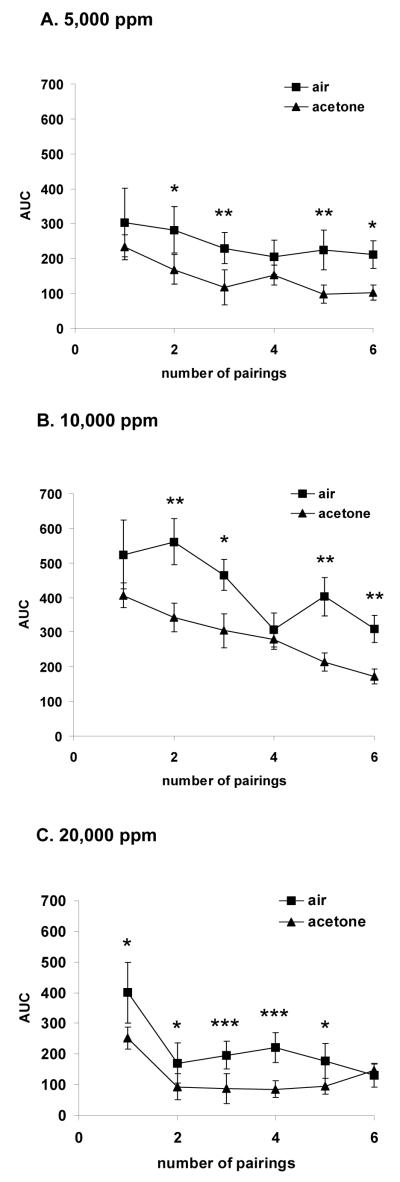
Figure 1.
(A-C) Mean (± S.E.M.) area under curve (AUC) of horizontal movement counts during 1 hour acetone inhalation period, separated into concentrations (5,000, 10,000 and 20,000 ppm; n=8/group), and air during a 60-min period on alternate days for a total of 6 pairings. The three-way ANOVA yield a significant effect of treatment F(1,287)=73, p < 0.001, exposure session F(5,287)=23, p < 0.001 and concentration F(2,287)=72, p < 0.001. Additionally, there was a significant interaction between exposure session and concentration F(10,287)=2, p < 0.05. Lastly, A pairwise multiple comparisons (Student-Newman-Keuls Method) revealed significant, * p<0.05, ** p<0.01, *** p<0.001, differences between each air session to each acetone session within the pairing regimen.

