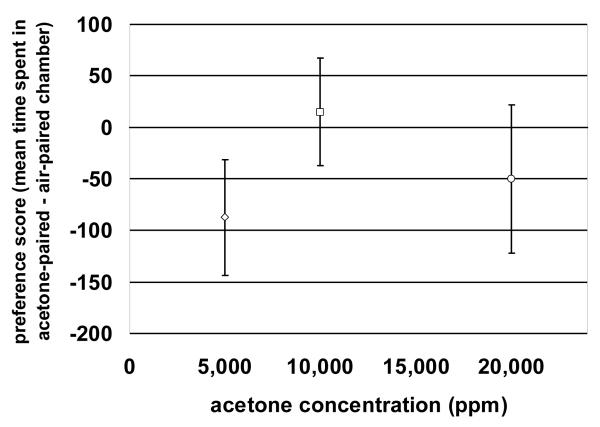
Figure 2.
Dose-effect relationship of acetone place preference conditioning. Preference scores (mean time spent in the acetone-paired chamber — mean time spent in the air-paired chamber) measured in an acetone-free environment (n = 8/group) after 6 pairing sessions for 1 hour duration. The preference scores are plotted on the y-axis as a function of the acetone concentration (5,000, 10,000, and 20,000 ppm) on the x-axis. A one-way repeated measures analysis of variance ANOVA comparison of preference score vs. concentration yielded a significant F(1,47) = 81, p < 0.001 dose-relationship effect.

