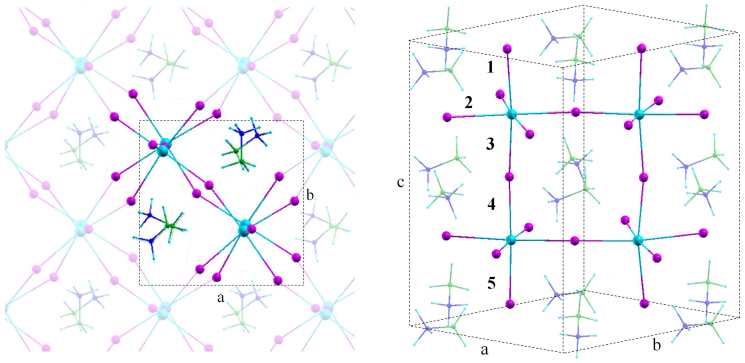
Figure 1. SR-DFT optimized structure of MAPbI3 viewed from two different orientations.
The unit cell is shown on the left. On the right we also show a labeling of the Pb-I bond distances reported in Table 1. Calculated (experimental9,26) cell parameters for MAPbI3: a = 8.78 (8.85–8.86) Å; c = 12.70 (12.64–12.66) Å. Calculated (experimental8,9) cell parameters for MASnI3: a = 8.71 (8.76–8.73) Å; c = 12.46 (12.43–12.50) Å. Pb = light blue; I = purple; N = blue; C = green.

