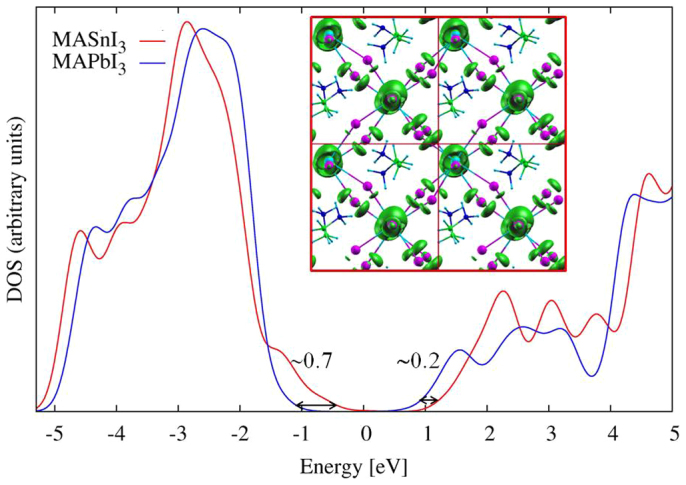
Figure 4. Electronic DOS for MASnI3 (red line) and MAPbI3 (blue line) calculated by SOC-GW.

The DOS have been aligned at the carbon 2p peak. Inset: SOC-DFT plot of the electron density associated to the highest occupied state of MASnI3 at the Γ point of the Brilluoin zone.
