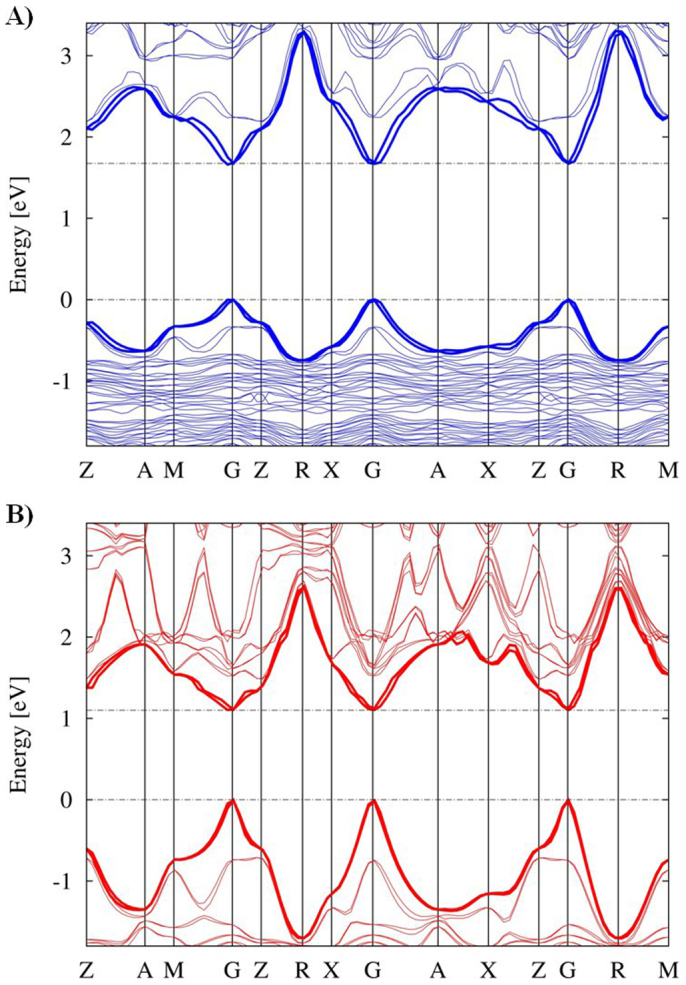
Figure 6. Calculated band structure (VB and CB highlighted as thick solid lines) for MAPbI3 (A, blue lines) and MASnI3 (B, red lines) along the directions Γ (0,0,0) → M (0.5, 0.5,0); Γ → Z (0,0,0.5); Γ → X (0,0.5,0); Γ → A (0.5,0.5,0.5); Γ → R (0,0.5,0.5), as calculated by SOC-GW.

The energy zero is set in both cases at the highest occupied state.
