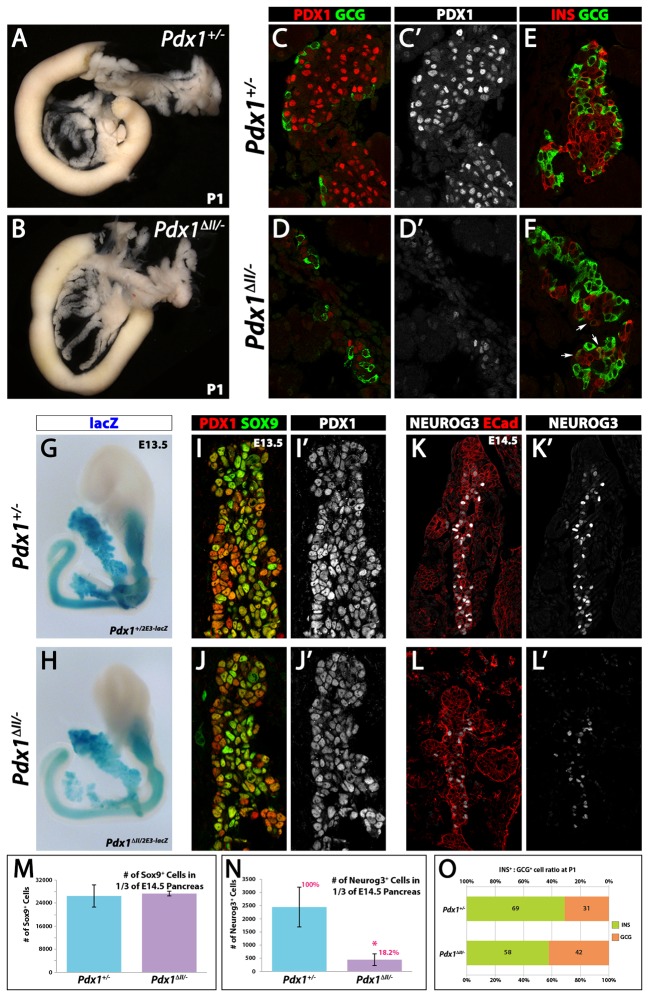
Fig. 2.
Endocrine-specific defects in the Pdx1ΔII/− pancreas. (A,B) Overall morphology of the Pdx1+/− and Pdx1ΔII/− pancreatic/duodenal region at P1. (C-D′) Gcg and Pdx1 expression (single Pdx1 channel and merge) in P1 endocrine clusters. (E,F) Ins and Gcg expression at P1. Arrows indicate Ins+ Gcg+ co-expressing cells. Note that the large cluster of hormonal cells shown in F was not commonly found in Pdx1ΔII/− and is shown for comparison. (G,H) Pdx12E3-lacZ reporter for Pdx1 transcriptional activities in E13.5 Pdx1+/− and Pdx1ΔII/− pancreata. (I-J′) Sox9 and Pdx1 expression at E13.5. (K-L′) Decreased Neurog3+ cell numbers are observed in E14.5 Pdx1ΔII/− pancreas (L,L′). (M,N) Morphometric analysis of Sox9+ cells and Neurog3+ cells at E14.5. *P<0.05. (O) Ins+:Gcg+ cell ratios in Pdx1+/− and Pdx1ΔII/− at P1.

