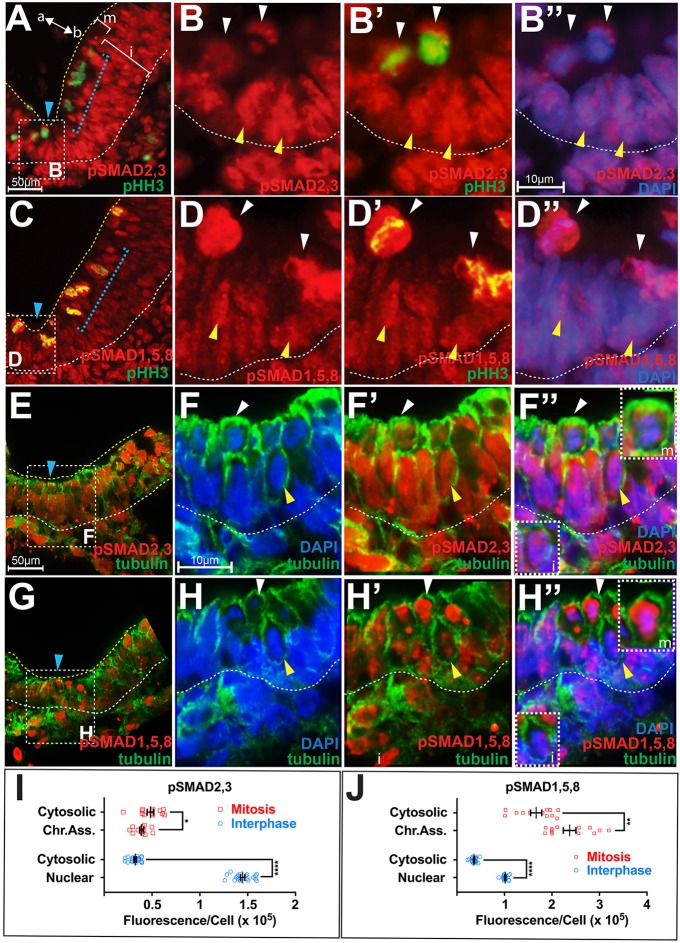
Fig. 1.
Cell-cycle-dependent modulation and nucleo-cytoplasmic shuttling of pSMAD2,3 and pSMAD1,5,8. (A,C) Low-power hemi-sections of HH7 neural plates showing pSMAD2,3 (A) and pSMAD1,5,8 modulation (C) along the apicobasal (a↔b) axis. Blue arrowhead, ventral midline. The location of pHH3+ mitotic (m) cells and interphase (i) nuclei is indicated. Boxed areas in A,C include the MHP and are magnified in B–B″ and D–D″, respectively. The scale bar for A and C is shown in A. The lateral neural plate region demarcated by the blue brackets is magnified in Fig. S1. (B–B″) Colabeling of pSMAD2,3 with pHH3 (B′) and DAPI (B″) shows that pSMAD2,3 expression is high and nuclear during interphase (yellow arrowheads), and low and cytosolic during mitosis (white arrowheads). (D–D″) pSMAD1,5,8 expression is low and nuclear during interphase (yellow arrowheads), and high and ubiquitous (chromatin-associated and cytosolic) during mitosis (white arrowheads). The scale bar for B–B″ and D–D″ is shown in B″. (E,G) Low-power hemi-sections of HH6 neural plates showing colabeling of pSMAD2,3 (E) and pSMAD1,5,8 (G) with acetylated tubulin. Boxed areas in E,G (MHP) are magnified in F–F″ and H–H″, respectively. Blue arrowhead, ventral midline. The scale bar for E and G is shown in E. (F–F″) DAPI, pSMAD2,3 and acetylated tubulin colabeling demonstrate that pSMAD2,3 expression is predominantly nuclear during interphase (yellow arrowhead, inset i in F″) and both chromatin-associated and cytosolic during mitosis (white arrowhead, inset m in F″). (H–H″) DAPI, acetylated tubulin and pSMAD1,5,8 colabeling demonstrate that pSMAD1,5,8 expression is nuclear during interphase (yellow arrowhead, inset i in H″), and both chromatin-associated and cytosolic during mitosis (white arrowhead, inset m in H″). The scale bar for F–F″ and H–H″ is shown in F. (I,J) Quantification of pSMAD fluorescence at the HH6–HH7 MHP; data are presented as mean±s.e.m.; n=35 cells from six brains. pSMAD2,3 (I) and pSMAD1,5,8 (J) fluorescence in the nucleus and cytoplasm of interphase and mitotic cells was compared using the Mann–Whitney test as follows: (1) pSMAD2,3 at mitosis, cytosolic versus chromatin-associated: 4.83×10⁴±9.25×10² versus 3.9×10⁴±5.56×10²; *P≤0.05); (2) pSMAD2,3 at interphase, cytosolic versus nuclear: 3.24×10⁴±1.33×10³ versus 1.44×10⁵±5.11×10²; ****P≤0.0001); (3) pSMAD1,5,8 at mitosis, cytosolic versus chromatin-associated: 1.81×10⁵±5.04×10³ versus 2.37×10⁵±1.59×10⁴; **P≤0.01); (4) pSMAD1,5,8 at interphase, cytosolic versus nuclear: 3.60x10⁴±1.33x10³ versus 1.01×10⁵±2.63×10², ****P≤0.0001). Other relevant comparisons are indicated in the text.

