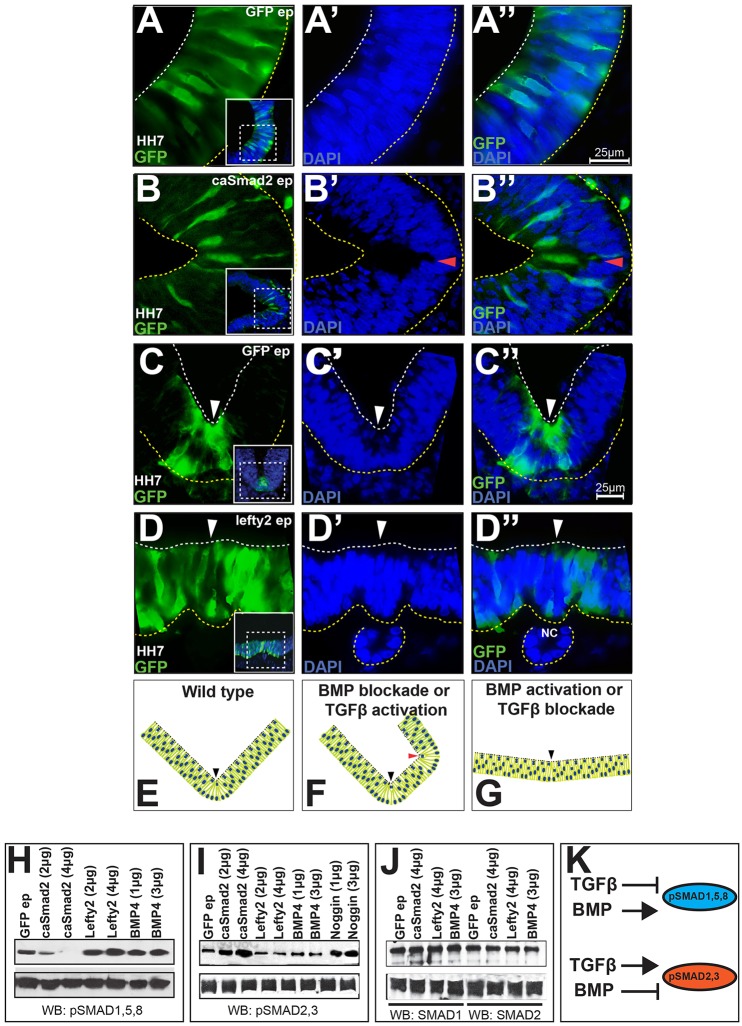
Fig. 2.
TGFβ signaling induces MHP formation by suppressing BMP activity. (A–D) TGFβ misexpression is necessary and sufficient for MHP formation. (A–A″) EGFP electroporations (ep) at HH5 do not alter the apical contours of the lateral midbrain at HH7. The embryonic ages noted on all micrographs reflect the time points at which brains were examined. The boxed areas in the insets in A–D are magnified in adjacent panels. White and yellow dotted lines mark the apical and basal surfaces. Scale bars for A–B″ and C–D″ are shown in A″ and C″, respectively. (B–B″) caSmad2 misexpression (green) at HH5 induces ectopic hinge points in lateral midbrain (arrowhead). (C–C″) EGFP electroporations at HH5 showing the normal contours of the ventral midline (arrowhead). (D–D″) Lefty2 misexpression (green) at the ventral midline (white arrowhead) flattens the endogenous MHP. NC, notochord. (E–G) Cartoons depicting the opposite effects of TGFβ and BMP signaling on MHP induction. Black arrowheads, ventral midline; red arrowhead, ectopic hinge point. BMP data summarized from Eom et al., 2011. (H–K) Cross-inhibition of r-SMAD phosphorylation underlies TGFβ–BMP antagonism. Top panel, western blotting of electroporated whole-cell midbrain lysates. Electroporated DNA concentration (µg/µl) is indicated above each lane. Bottom panel, loading controls (α-tubulin). (H) Compared to EGFP controls, caSmad2 electroporations reduce, and Lefty2 and BMP4 electroporations increase pSMAD1,5,8 levels. (I) caSmad2 and Noggin electroporations increase, and Lefty2 and BMP4 reduce pSMAD2,3 levels. (J) The total levels of SMAD1 and SMAD2 proteins remain unchanged following BMP and TGFβ manipulations. (K) Cartoon illustrating that TGFβ and BMP phosphorylate their own r-SMADs, while inhibiting the phosphorylation of the r-SMADs from the other pathway.

