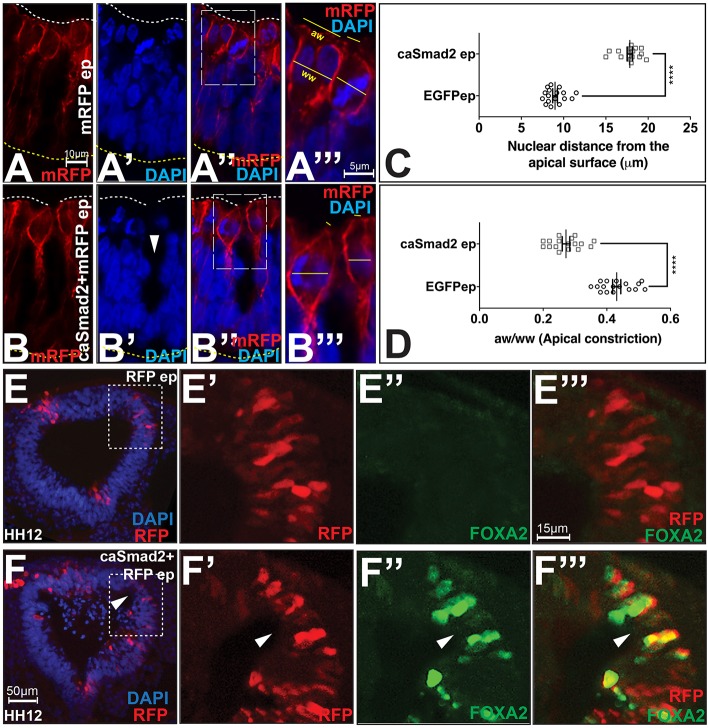
Fig. 3.
TGFβ signaling regulates cell shapes and fates at the MHP. (A–B‴) Compared to controls (A–A‴), caSmad2+mRFP electroporated mitotic cells (B–B‴) display basally located nuclei (arrowhead) and apical constriction, demonstrated by a reduced apical width (aw):widest width (ww) ratio (see Materials and Methods). The boxed area in A″ is magnified in A‴ and shows mitotic cells in cytokinesis (left) and metaphase (right) stages. Scale bar for A and B is shown in A, and for A‴ and B‴ in A‴. (C) Quantification of basal nuclear localization in HH7 brains. Data are presented as mean±s.e.m. Nuclear distances from the apical surface for control (9.43 µm, n=85 cells from 17 brains) and caSmad2 electroporated cells (17.8 µm, n=100 cells from 17 brains) are significantly different. ****P≤0.0001 (Mann–Whitney test). (D) Quantification of apical constriction in HH7 brains. Data are presented as mean±s.e.m. The apical width:widest width (aw/ww) ratio of control cells=0.43 (n=70 cells/17 brains) and caSmad2-electroplated cells=0.3 (n=89 cells/17 brains) are significantly different. ****P≤0.0001 (Mann–Whitney test). (E–F‴) Compared to controls (E–E‴), midbrains electroporated with caSmad2 at HH4–HH5 display ectopic hinge points (arrowhead, F–F‴) with robust FOXA2 expression. E′–E‴ and F′–F‴ are magnified views of the boxes in E and F, respectively. Scale bar for E and F is shown in F, and for E′–E‴ and F′–F‴ is shown in E‴. See also Fig. S2E–H‴.

