Fig. 5.
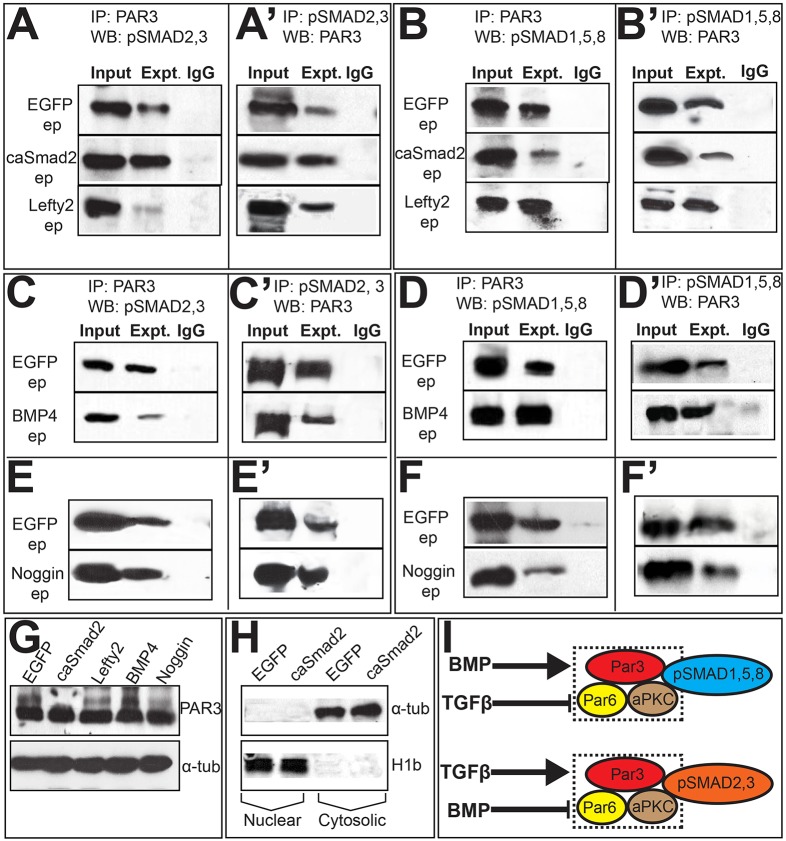
TGFβ and BMP signals modulate pSMAD–PAR3 interactions in opposite directions. Each panel (A–F′) represents a single co-immunoprecipitation (IP) and western blotting (WB) experiment on cytosolic extracts, with lanes cut and aligned vertically for clarity. Experimental lanes in each panel should be compared to their own EGFP controls (top row) and not to EGFP controls in adjacent panels. Co-immunoprecipitation and western blotting in A–F were reversed in A′–F′, respectively. ep, electroporation. (A,A′) Compared to EGFP, caSmad2 increases and Lefty2 reduces PAR3–pSMAD2,3 interactions. (B,B′) caSmad2 reduces and Lefty2 increases PAR3–pSMAD1,5,8 interactions. (C–D′) BMP4 reduces PAR3–pSMAD2,3 interactions (C,C′) and increases pSMAD1,5,8–PAR3 interactions (D,D′). (E–F′) Noggin electroporations increase PAR3–pSMAD2,3 interactions (E,E′) and reduce PAR3–pSMAD1,5,8 interactions. (G) Top panel, western blotting of whole-cell lysates electroporated with EGFP, caSmad2, Lefty2, BMP4 or Noggin display similar levels of PAR3 protein. Bottom panel, loading controls. (H) Western blotting with anti-H1b (nuclear) and anti-α-tubulin (cytosolic) antibodies demonstrating the purity of cytosolic extracts prepared from EGFP and caSmad2-electroporated midbrains. (I) Cartoon summarizing the results shown in A–F.

