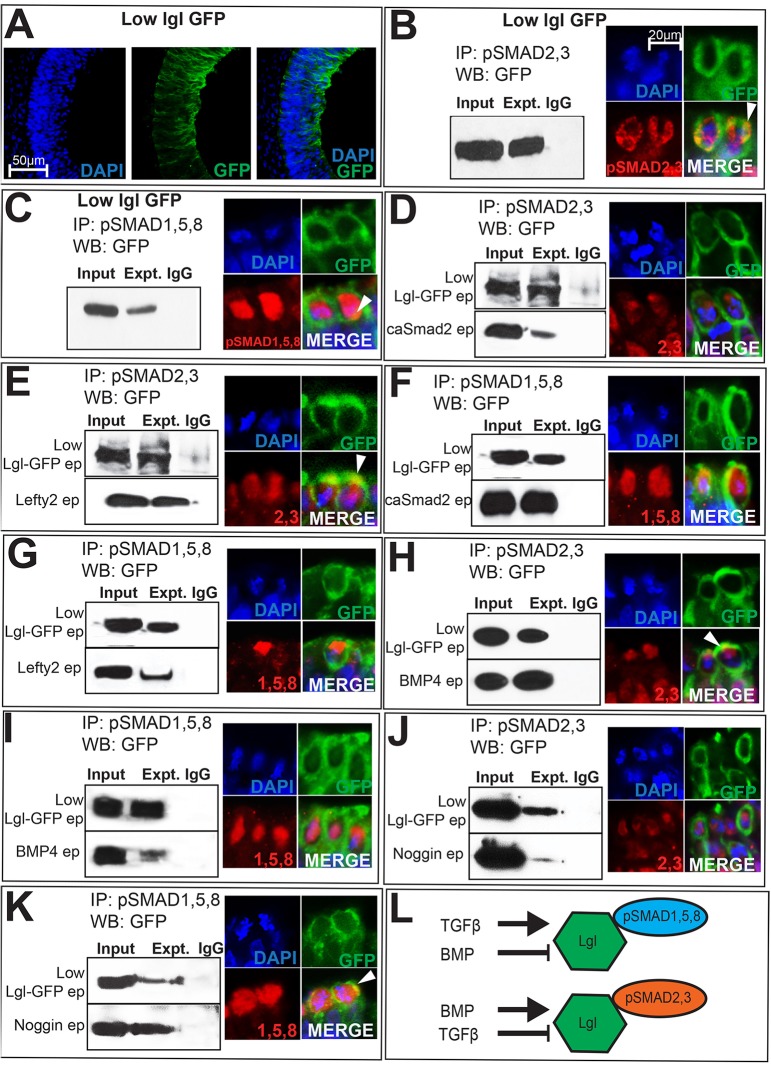
Fig. 6.
LGL1–pSMAD interactions occur in the cytosol and are ligand dependent. (A) Absence of colocalization with DAPI demonstrates the cytosolic restriction of electroporated (ep) Lgl1–GFP. (B,C) Cytosolic extracts from Lgl1–GFP (1 µg/µl) electroporated cells display biochemical interactions between LGL1–GFP and pSMAD2,3 (B), and LGL1–GFP and pSMAD1,5,8 (C). Lgl1–GFP electroporations combined with pSMAD immunohistochemistry display cytosolic overlap between LGL1–GFP and pSMAD proteins (arrowheads, B,C). (D–K) Panels on the left represent single co-immunoprecipitation (IP) and western blotting (WB) experiments on cytosolic extracts, with lanes cut and aligned vertically for clarity. Experimental lanes in each panel should be compared to their own Lgl1–GFP controls (top row) and not to Lgl1–GFP controls in adjacent panels. Panels on the right provide immunohistochemical evidence of overlap (arrowheads) between LGL1–GFP and pSMAD2,3 or pSMAD1,5,8. (D,E) Compared to Lgl1–GFP controls, caSmad2 reduces and Lefty2 increases LGL1–GFP–pSMAD2,3 interactions. (F,G) Compared to controls (top panel), caSmad2 increases and Lefty reduces pSMAD1,5,8–LGL1–GFP interactions. (H,I) BMP4 increases LGL1–GFP–pSMAD2,3 interactions (H) and reduces pSMAD1,5,8–LGL1–GFP (I) interactions. (J,K) Noggin reduces pSMAD2,3–LGL1–GFP interactions (J) and increases pSMAD1,5,8–LGL1–GFP interactions (K). The scale bar in B applies to all immunohistochemical panels (B–K). (L) Cartoon summarizing data shown in B–K.

