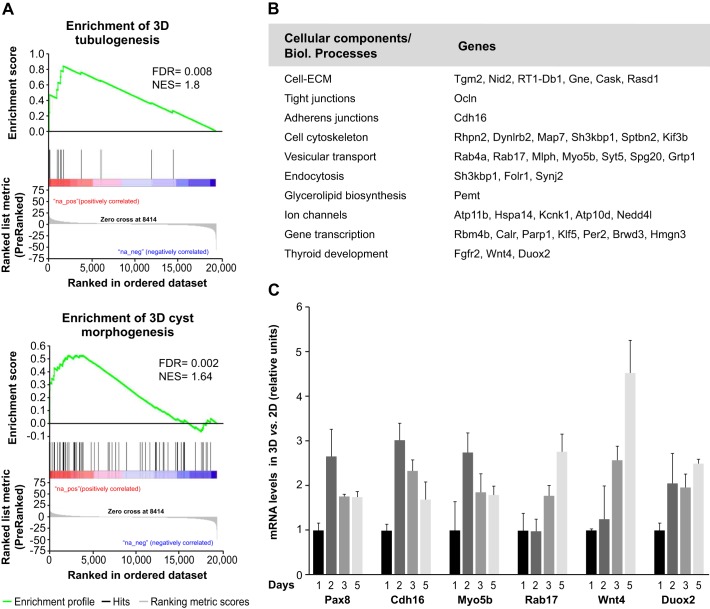
Fig. 3.
Differential expression of structural and functional cell components is necessary for 3D follicle formation. (A) GSEA statistic plots of 3D vs 2D culture gene expression profiles compared to different gene sets. Gene set enrichment plot of molecular regulators of tubulogenesis (top) and 3D MDCK cyst morphogenesis (bottom). FDR, false discovery rate q-value; NES, normalized enrichment score. (B) Common upregulated genes in 3D culture and Pax8 positively regulated genes classified according to their participation in biological processes. (C) Relative mRNA expression of a selected panel of genes that were upregulated during 3D follicle formation. FRT cells were grown for the indicated number of days (x-axis) in 2D and 3D culture. Quantitative data was normalized to expression levels in 2D culture and related to expression in 3D culture at day 1 (relative units). Standard deviation is depicted with positive error bars (n=3 biological repeats).

