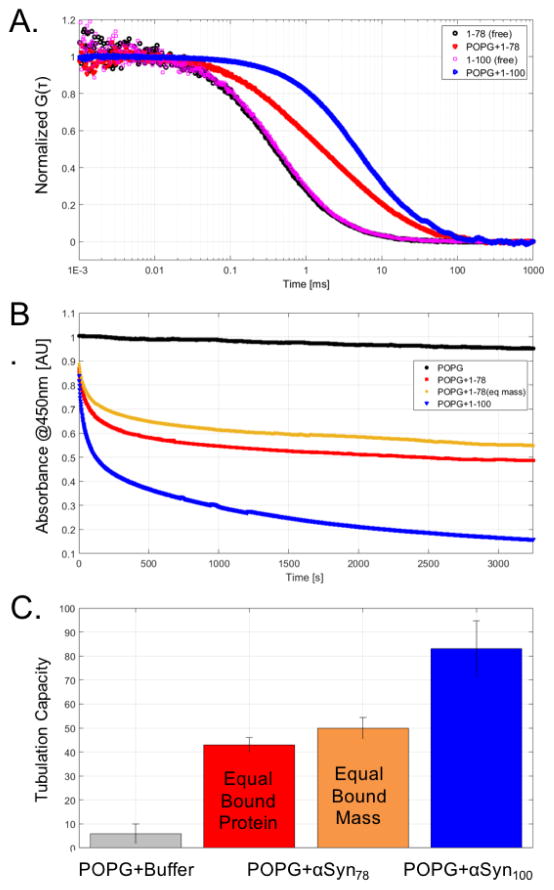
Figure 3.
(A) FCS traces for αSyn78 and αSyn100 in the absence (black or magenta) or presence of POPG (red or blue). (B) Vesicle clearance absorbance traces for POPG + buffer (black), POPG + αSyn78 at equal protein concentration (red), POPG + αSyn78 at equal mass of protein (orange), and POPG + αSyn100 (blue). (C) Tubulation capacities for αSyn constructs relative to buffer.

