Figure 5.

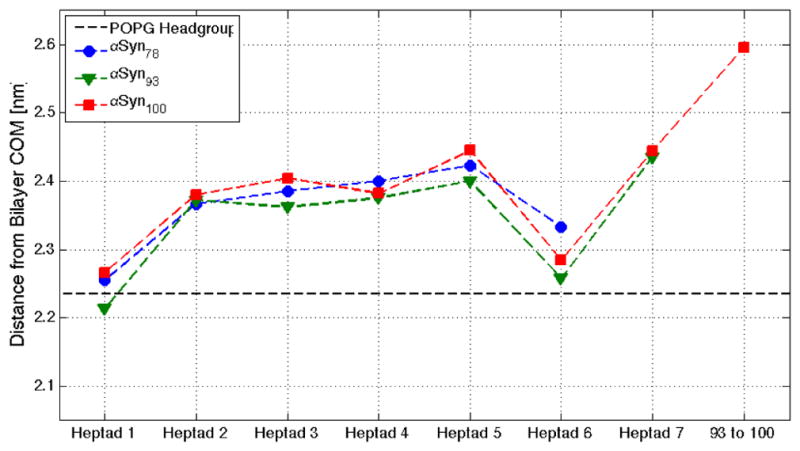
Heptad depth profile for αSyn constructs. Depth profiles for αSyn78 (blue), αSyn93 (green), and αSyn100 (red) are parsed by heptad and illustrate differential penetration relative to the POPG headgroup (black dashed-line).

Heptad depth profile for αSyn constructs. Depth profiles for αSyn78 (blue), αSyn93 (green), and αSyn100 (red) are parsed by heptad and illustrate differential penetration relative to the POPG headgroup (black dashed-line).