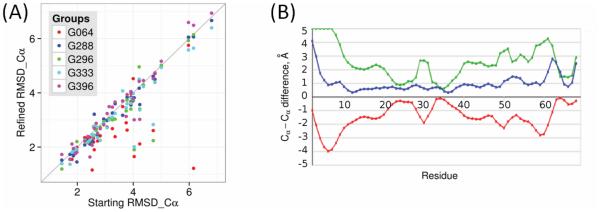
Figure 2. CASP11 refinement performance.
(A) Cα RMSDs [Å] of the refined vs. original models for some of the best performing groups. Points below the diagonal represent improvement. Where models get worse in refinement, the loss of accuracy is small. In some cases, improvements of 2Å or more are achieved. (B) Best residue-by-residue refinement of the CASP11 target TR829 (Cα-Cα distance to target for the refined (TR829TS064_2, blue) and original (T0829TS499_1, green) models, and the difference between them (improvement, red) [Å]). In this case, there are substantial improvements in the areas that were least accurate (lowest portions of the red line) in the starting structure.

