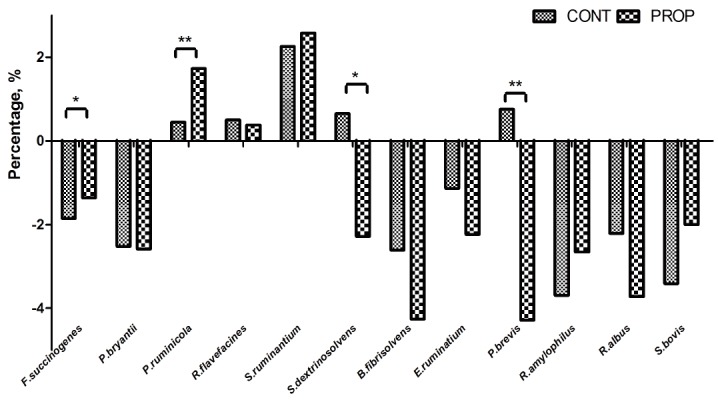
Figure 4.

Difference in relative abundance of selected bacterial species between control feeding group (CONT) and calcium propionate supplementation (PROP). Percent data were common log-transformed prior to analysis. Asterisk shows significant differences between groups (** p<0.01, * p<0.05, T test, SAS, Institute, Cary, NC, USA).
