Figure 2.

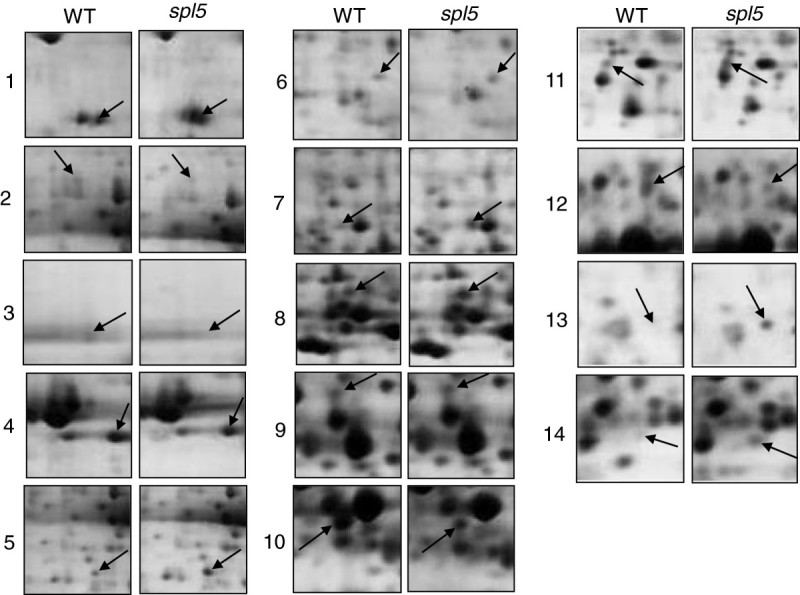
Magnified regions of 2-DE gels. Numbers at the left of images indicate protein spots showed by arrows in Figure 1 with significantly differential accumulation levels between spl5 and WT mutant in 2-DE gel analysis.

Magnified regions of 2-DE gels. Numbers at the left of images indicate protein spots showed by arrows in Figure 1 with significantly differential accumulation levels between spl5 and WT mutant in 2-DE gel analysis.