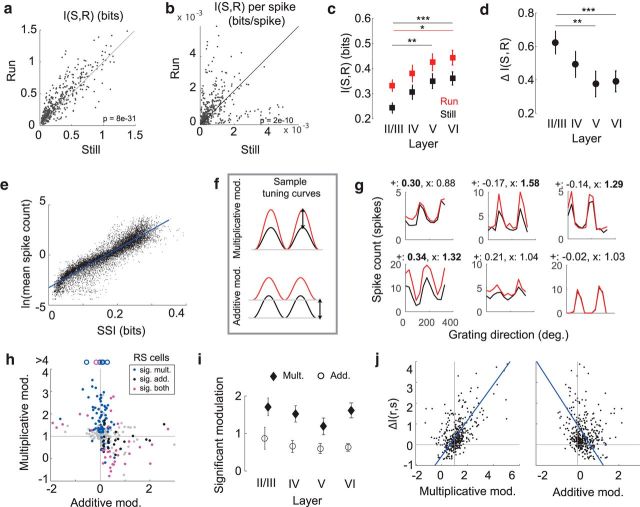
Figure 2.
Cortical state affects single-neuron activity. a, Single-cell mutual information, I(S, R), during running and rest (N = 409, p = 8e-31, Wilcoxon signed-rank test). Gray line indicates unity. b, I(S, R) per spike (N = 409, p = 6e-12, Wilcoxon signed-rank test). Gray line indicates unity. c, Average behaviorally dependent I(S, R), within each cortical layer. Layer II, N = 112; layer IV, N = 90; layer V, N = 84; layer VI, N = 123. Error bars indicate bootstrapped estimates of SE. *p = 0.012 (Wilcoxon rank-sum test). **p = 0.002 (Wilcoxon rank-sum test). ***p = 0.0007 (Wilcoxon rank-sum test). p values were corrected for multiple comparisons using the Holm–Bonferroni method. d, Fractional change in mutual information, ΔI(S,R), within each cortical layer during running. Error bars indicate bootstrapped estimates of SE. **p = 0.002 (Wilcoxon rank-sum test). ***p < 0.0005 (Wilcoxon rank-sum test). p values were corrected for multiple comparisons using the Holm–Bonferroni method. e, Relationship between average spike count and stimulus-specific information, SSI(s). Each point indicates the SSI of a single cell to a particular grating movement direction (N = 4908). Blue line indicates fit of linear regression (R2 = 0.85, p < 1e-30). f, Schematic of multiplicative (top) and additive (bottom) tuning curve shifts from rest (black) to locomotion (red). g, Sample single-cell tuning curves for evoked responses at rest (black) and during locomotion (red), with values of additive and multiplicative modulation printed above each. Bold represents significant modulation. h, Relationship between additive and multiplicative components of modulation for rapidly spiking cells (N = 409, ρ = −0.315, p = 1.2e-7). Gray points indicate cells with no significant modulation. Colors represent significant modulation for multiplicative (blue), additive (black), or both (magenta) components. Gray lines represent null hypotheses that no modulation occurs. Open circles represent data points outside of plot range. i, Average modulation across cortical layers during locomotion for cells that are significantly modulated. Error bars indicate bootstrapped estimates of SE. j, ΔI(S,R) as a function of multiplicative (left; ρ = 0.58, p = 2.4e-38) and additive (right; ρ = −0.16, p = 0.001) components of modulation (N = 409). Lines as described in h. Blue line indicates fit of linear regression.

