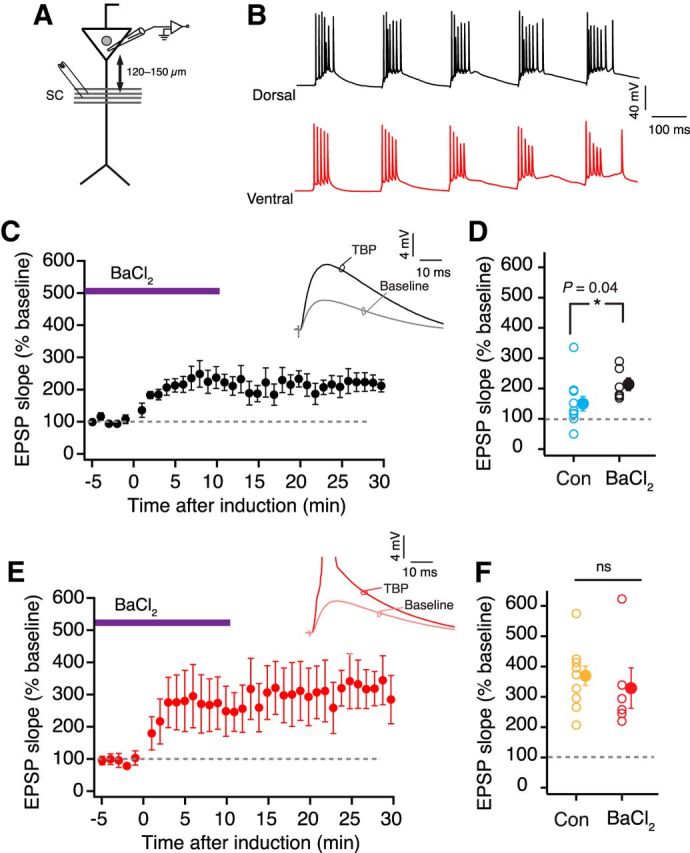
Figure 10.

Somatic LTP recordings with resting GIRK conductance blocked by Ba2+. A, Schematic representing the experimental configuration. Voltage responses were measured at the soma. EPSPs were evoked using a stimulating electrode placed at the SC inputs (∼120–150 μm from soma). B, Example voltage traces recorded at the soma from dorsal (A) and ventral neurons (C) during five bursts of TBP train in the presence of BaCl2. C, Time course plot of normalized EPSP slope (mean ± SEM) in dorsal neurons (n = 6) when TBP-LTP was induced in the presence of BaCl2. Inset, Example EPSP traces recorded from dorsal somatic recordings during baseline and after TBP. D, Scatter plot comparing the amount of LTP in control recordings (blue, n = 10) versus LTP recordings in the presence of BaCl2 (black, n = 6) in dorsal CA1 neurons (unpaired t test, t(14) = 1.7, p = 0.04). E, Time course plot of normalized EPSP slope (mean ± SEM) in ventral neurons (n = 6) when TBP-LTP was induced in the presence of BaCl2. Inset, Example EPSP traces recorded from ventral neurons during baseline and after TBP. F, Scatter plot comparing the amount of LTP induced in control recordings (orange, n = 10) versus LTP recordings in the presence of BaCl2 (red, n = 6) in ventral CA1 neurons (unpaired t test, t(14) = 0.6, p = 0.26). Open circles represent individual cells. Closed circles represent mean ± SEM.
