Figure 11.
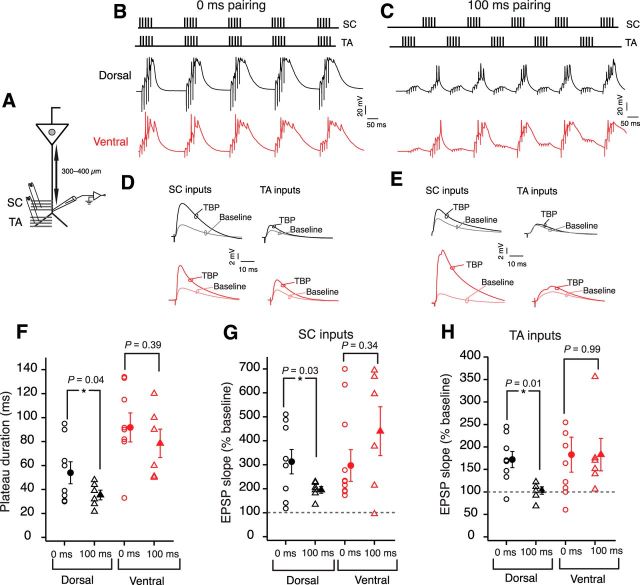
Coincident SC and TA inputs boost LTP in dorsal neurons. A, Schematic represents the experimental configuration. Voltage responses were measured at the distal apical dendrite (300–400 μm). EPSPs were evoked using stimulating electrodes placed at the SC inputs and TA inputs. B, C, Top, Schematic showing the pairing of SC EPSPs with TA EPSPs during TBP protocol. Bottom, Example voltage traces recorded from dorsal dendrites (black) and ventral (red) dendrites during five bursts of TBP train; time interval between two inputs during LTP induction was 0 ms (B) and 100 ms (C). D, E, Example SC and TA EPSPs recorded during baseline and after TBP. Black represents dorsal traces. Red represents ventral traces. The time difference between two inputs during LTP induction was 0 ms (D) and 100 ms (E). F–H, Summary plots for plateau duration (F) (unpaired t test, dorsal: t(12) = 2.2, p = 0.04; ventral: t(14) = 0.87, p = 0.39), LTP at SC inputs (G) (unpaired t test; dorsal: t(12) = 2.47, p = 0.03; ventral: t(14) = 0.97, p = 0.34), and LTP at TA inputs (H) (unpaired t test; dorsal: t(12) = 3, p = 0.01; ventral: t(14) = 0.006, p = 0.99) for dorsal (black) and ventral (red) dendrites. Circles represent data points corresponding to 0 ms pairing protocol (dorsal, n = 8; ventral, n = 10). Triangles represent data points corresponding to 100 ms pairing protocol (dorsal, n = 6; ventral, n = 6). Open symbols represent individual cells. Closed symbols represent mean ± SEM. *p < 0 0.05.

