Figure 2.
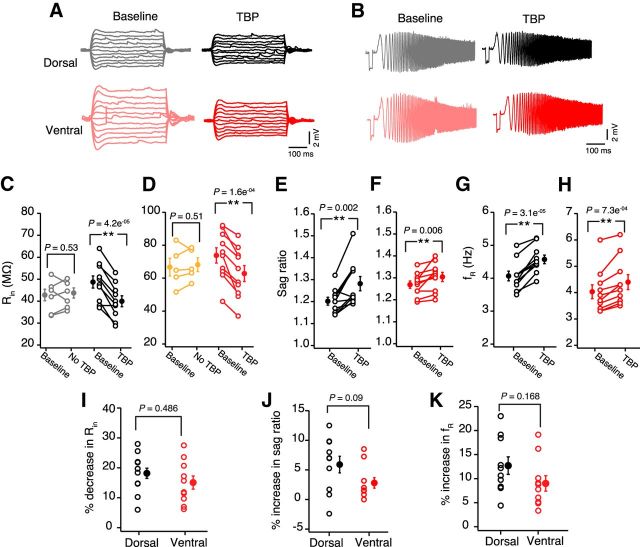
No dorsoventral differences in TBP-induced intrinsic plasticity. A, Representative voltage responses to 800 ms long depolarizing and hyperpolarizing current injections (−50 to 50 pA, steps of 10 pA) during baseline and after TBP in dorsal (black) and ventral (red) neurons. B, Representative voltage traces illustrating the membrane resonance in response to a CHIRP stimulus (0–15 Hz, 15 s) during baseline and after TBP recorded from example dorsal and ventral CA1 neurons. Left, Traces were recorded during baseline. Right, Traces were recorded 30 min after TBP. C, D, Significant reduction in the Rin of dorsal (C) (paired t test, t(9) = 7.3, p = 4.2e−5; n = 10) and ventral neurons (D) (paired t test, t(9) = 6.15, p = 1.6e−4; n = 10) after TBP. No change in Rin was observed in dorsal (C) (gray; paired t test, t(6) = 0.65, p = 0.53; n = 7) and ventral neurons (D) (orange; paired t test, t(5) = 0.7, p = 0.51; n = 6) in control recordings (with no TBP induction). E, F, Significant increase in the sag ratio after TBP in dorsal (E) (paired t test, t(9) = 2.7, p = 0.002; n = 10) and ventral (F) (paired t test, t(9) = 3.1, p = 0.006; n = 10) CA1 neurons. G, H, Significant increase in the fR after TBP in dorsal neurons (G) (paired t test, t(9) = 7.66, p = 3.1e−5) and ventral neurons (H) (paired t test, t(9) = 5, p = 7.3e−4). I, TBP-induced percentage decrease in Rin was similar for dorsal and ventral CA1 neurons (unpaired t test, t(18) = 0.7, p = 0.486). J, TBP-induced percentage increase in the sag ratio was similar for dorsal and ventral neurons (unpaired t test, t(18) = 1.8, p = 0.09). K, Percentage increase in fR after TBP in dorsal and ventral neurons was similar (unpaired t test, t(18) = 1.48, p = 0.15). Open circles represent individual cells. Closed circles represent mean ± SEM. **p < 0.01.

