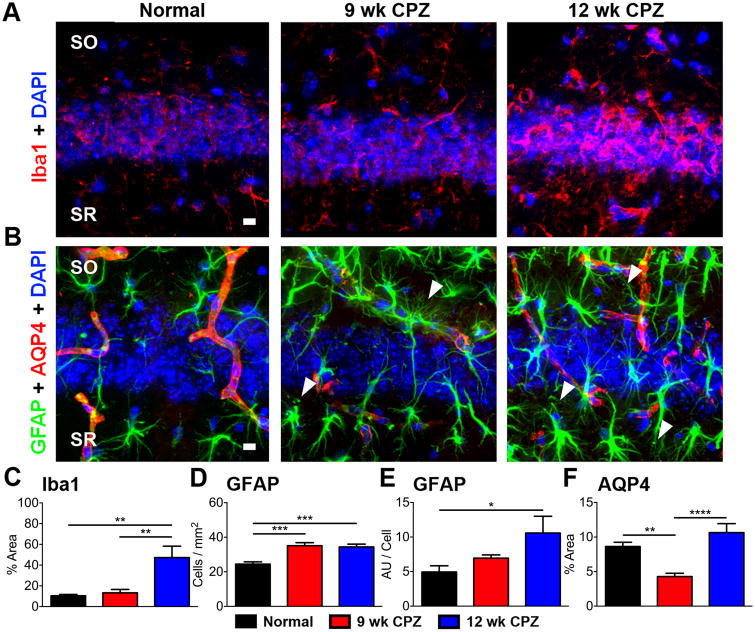
Figure 3. Macrophage/microglia infiltration, reactive astrocytes, and altered AQP4 expression are observed in the CA1 of chronically cuprizone-fed mice with seizures.
A) Representative 40× magnification images of Iba1 (red) and DAPI (blue) immunostained CA1 SO/SR from normal, 9 wk CPZ, and 12 wk CPZ mouse coronal brain sections showing increased Iba1 reactivity in 12 wk CPZ mice. Scale bar: 10 μm.
B) Representative 40× magnification images of GFAP (green), AQP4 (red) immunostaining, and DAPI (blue) stained CA1 SO/SR of normal, 9 wk CPZ, and 12 wk CPZ mice. The number of GFAP+ astrocytes and staining intensity per cell increased in the CA1 of 9 wk and 12 wk CPZ mice and displayed hypertrophic morphology characteristic of reactive astrocytes, membrane varicosities, and loss of non-overlapping process domains (arrowheads). In normal mice, AQP4+ staining followed vasculature and co-localized with GFAP at the site of astrocyte end foot processes contacting blood vessels. AQP4 staining decreased in 9 wk CPZ mice, but GFAP staining increased proximal to vasculature. AQP4 reactive area returned to normal levels in 12 wk CPZ mice and GFAP+ reactive astrocytes did not accumulate near blood vessels. Scale bar: 10 μm. C) Iba1+ immunostaining in the CA1 was quantified as a percent of imaged field in normal, 9 wk CPZ, and 12 wk CPZ mice. Iba1+ microglia/macrophages occupied approximately 10—13% of the imaged CA1 in normal and 9 wk CPZ mice, but increased more than three-fold in 12 wk CPZ mice to 47.29±10.98% (12 wk CPZ vs normal, **p≤0.01; 12 wk CPZ vs 9 wk CPZ **p≤0.01). 7-9 animals/group, one-way ANOVA with Tukey's posttest for multiple comparisons, η2=0.5128.
D—E) Astrocytes were quantified by counting number of GFAP+ cells/area. A significant increase was observed in the CA1 of 9 wk CPZ (***p≤0.001) and 12 wk CPZ (***p≤0.001) groups compared to normal mice. GFAP staining intensity (represented in arbitrary units “AU”) per astrocyte also rose significantly in 12 wk CPZ mice compared to normal mice *p≤0.05), indicating increased GFAP expression per cell. 8-10 animals/group, one-way ANOVA with Tukey's posttest for multiple comparisons, GFAP+ cells/mm2 η2=0.5658; GFAP intensity per cell η2=0.2514.
F) AQP4 reactive area was significantly decreased in the CA1 of 9 wk CPZ mice compared to normal (**p≤0.01) and 12 wk CPZ groups (****p<0.0001). 7-10 animals/group, one-way ANOVA with Tukey's posttest for multiple comparisons, η2=0.5668.

