Figure 1.

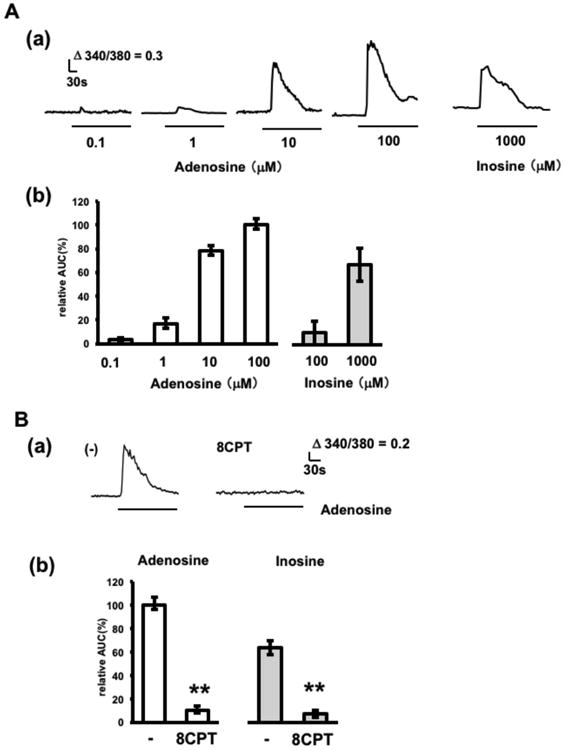
Adenosine- and inosine-induced calcium elevations in adenosine sensor cells. A. Concentration dependent effects of adenosine and inosine. (a) Representative calcium increases in response to 0.1-100 μM adenosine and 1000 μM inosine. (c) Average calcium increases (n=29–40 cells from 3–-4 experiments). Cells were stimulated with adenosine or inosine at the concentrations indicated. The relative area under the curve during stimulation (relative AUC) was calculated by normalizing to the calcium increase achieved by 100 μM adenosine. B. Effect of an A1 receptor antagonist. Cells were stimulated with 10 μM adenosine or 1000 μM inosine in the presence or absence of 1 μM 8CPT. 8CPT treatment was started 5 min prior to stimulation with adenosine and continued during stimulation (pretreatment; 5 min). (a) Representative adenosine-induced calcium increases in the presence or absence of 8CPT. (b) Average calcium increases (n= 30–40 cells from 3–4 experiments). Relative AUC was calculated by normalizing to the calcium increase to adenosine in the absence of blocker. **p < 0.01, t-test.
