Figure 2.


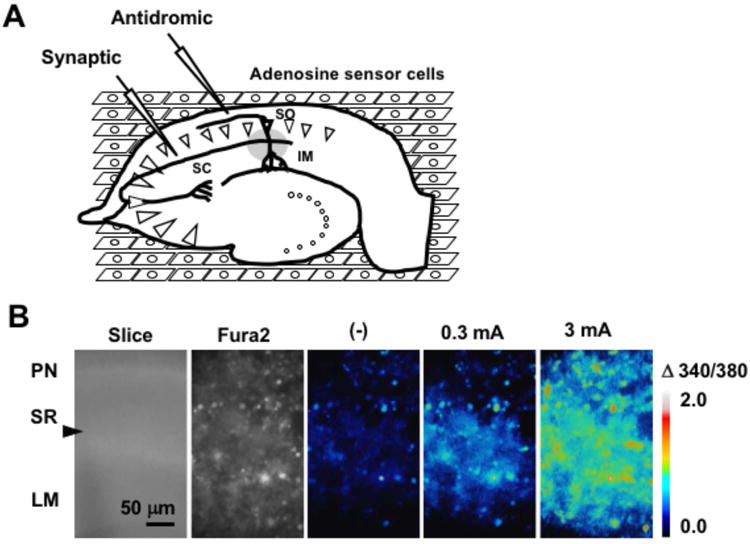
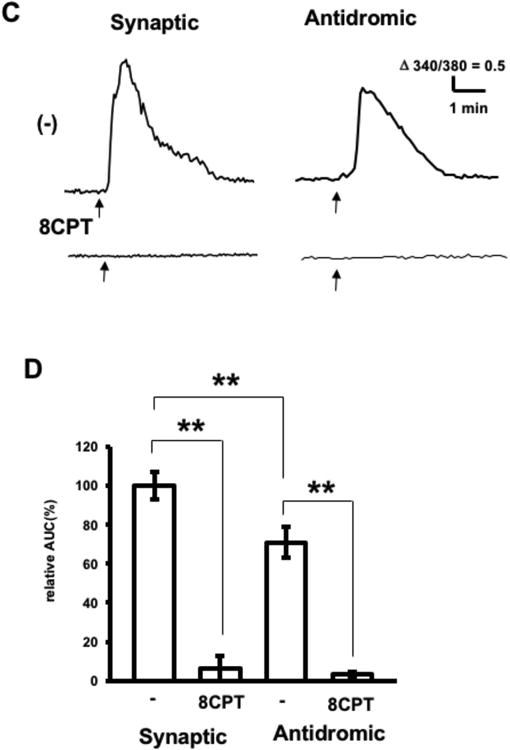
Electrically-induced adenosine release by hippocampal slices. A. Experimental diagram. SC, Schaffer collateral; SO, Striatum oriens; IM, Imaging area of the inverted microscope (gray circular area). The stimulating electrode was placed on the SC for synaptic stimulation (Synaptic) or on the SO for antidromic stimulation (Antidromic). B. Calcium responses of adenosine sensor cells to synaptic stimulation. Bright field image of a hippocampal slice above the adenosine sensor cells (Slice). PN; Pyramidal neurons in the CA1 region; SR, Stratum radiatum; LM, Stratum lacunosum moleculare. The stimulating glass electrode was placed as indicated by the arrowhead. Fura2 fluorescence image of the adenosine sensor cells (Fura2). Ratio of the image (340 nm/380 nm) before stimulation (-), and 15 sec after high-frequency electrical stimulation (30 Hz for 5 sec) at 0.3 mA or 3 mA. C. Representative calcium increases in adenosine sensor cells in response to synaptic or antidromic stimulation (3 mA, 30 Hz for 5 sec, arrow) in the absence or presence of 8CPT (pretreatment 20 min). D. Average calcium increases in adenosine sensor cells in response to synaptic or antidromic stimulation, with results normalized to response to synaptic stimulation in the absence of 8CTP. Each n= 29–47 cells from 3–5 experiments, **p < 0.01, t-test.
