Figure 1.
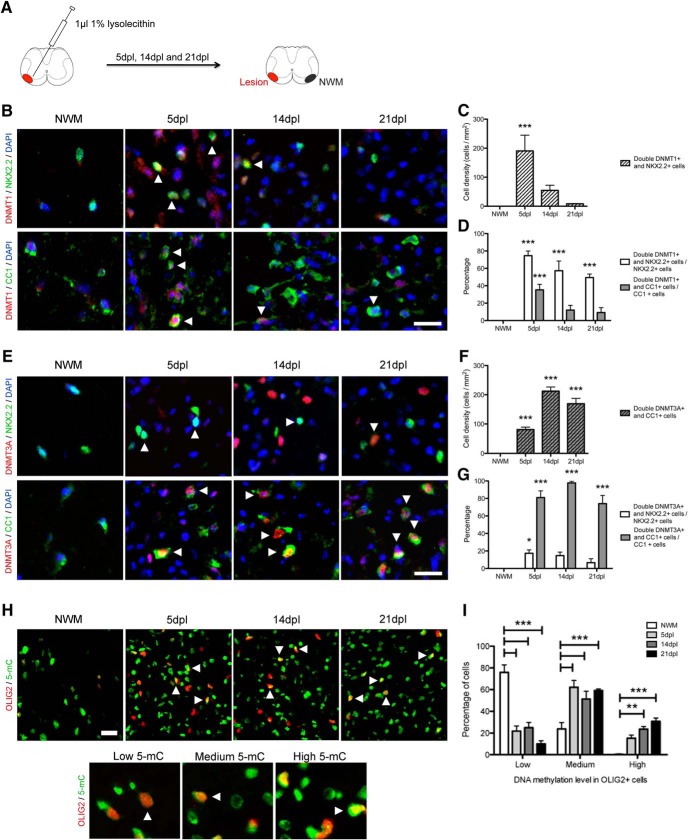
DNA methyltransferases are differently expressed in adult OPCs during remyelination. A, Schematic of the lysolecithin-induced focal demyelination and of the area of NWM used for quantification. B, Representative DNMT1, NKX2.2, and CC1 stainings in NWM and at 5, 14, and 21 dpl (white arrowheads indicate double-positive cells). C, Quantification of the number of double DNMT1+ and NKX2.2+ cells at 5, 14, and 21 dpl, compared with NWMa. D, Quantification of the percentage of double DNMT1+ and NKX2.2+ or CC1+ cells at 5, 14, and 21 dpl, compared with NWMb. E, Representative DNMT3A, NKX2.2, and CC1 stainings in NWM and at 5, 14, and 21 dpl (white arrowheads indicate double-positive cells). F, Quantification of the number of double DNMT3A+ and CC1+ cells at 5, 14, and 21 dpl, compared with NWMc. G, Quantification of the percentage of double DNMT3A+ and NKX2.2+ or CC1+ cells at 5, 14, and 21 dpl, compared with NWMd. H, Representative 5mC and OLIG2 staining in NWM and at 5, 14, and 21 dpl (white arrowheads indicate high-5mC+/OLIG2+ cells). Representative low-, medium-, and high-5mC cells are shown below. I, Quantification of low-, medium-, and high-5mC levels in OLIG2+ cells at 5, 14, and 21 dpl, compared with NWMe. Scale bar = 20 µm. Data are mean ± SEM. n = 4–6 animals, three sections per animal. *p < 0.05, **p < 0.01, ***p < 0.001 (ANOVA).

