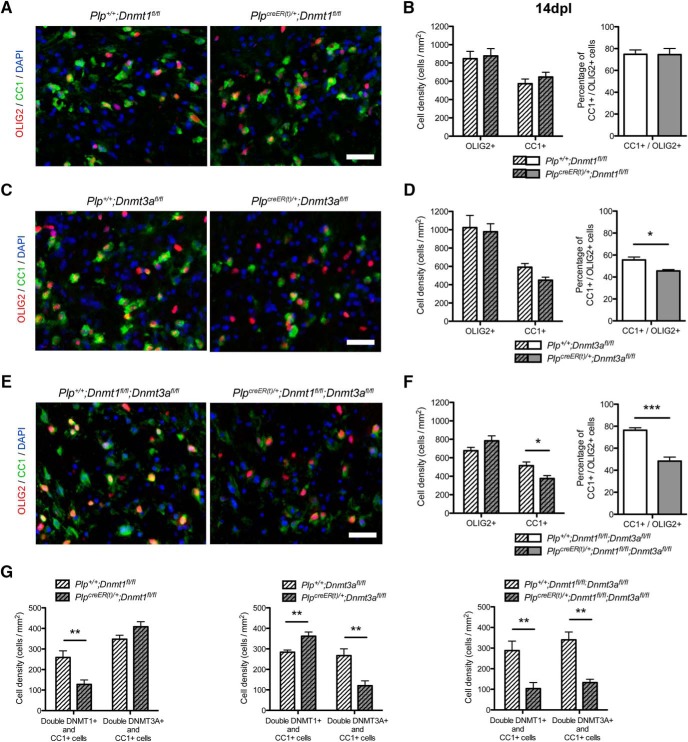
Figure 3.
Ablation of Dnmt3a and both Dnmt1 and Dnmt3a impairs oligodendrocyte differentiation during remyelination. A, Representative OLIG2 and CC1 staining at 14 dpl in tamoxifen-treated Plp+ /+;Dnmt1fl/fl and PlpcreER(t) /+;Dnmt1fl/fl spinal cords. B, Quantification of OLIG2+ and CC1+ cell densities and CC1+/OLIG2+ cells percentage at 14 dpll (p = 0.7955, p = 0.3573, p = 0.9689). C, Representative OLIG2 and CC1 staining at 14 dpl in tamoxifen-treated Plp+ /+;Dnmt3afl/fl and PlpcreER(t) /+;Dnmt3afl/fl spinal cords. D, Quantification of OLIG2+ and CC1+ cell densities and CC1+/OLIG2+ cells percentage at 14 dplm (p = 0.7851, p = 0.0550, p = 0.0149). E, Representative OLIG2 and CC1 staining at 14 dpl in tamoxifen-treated Plp+ /+;Dnmt1fl/fl;Dnmt3afl/fl and PlpcreER(t) /+;Dnmt1fl/fl;Dnmt3afl/fl spinal cords. F, Quantification of OLIG2+ and CC1+ cell densities and CC1+/OLIG2+ cells percentage at 14 dpln (p = 0.1510, p = 0.0357, p = 0.0006). G, Quantification of DNMT1 and DNMT3A expression in CC1+ cells at 14 dpl in tamoxifen-treated Plp+ /+;Dnmt1fl/fl and PlpcreER(t) /+;Dnmt1fl/fl, Plp+ /+;Dnmt3afl/fl and PlpcreER(t) /+;Dnmt3afl/fl, Plp+ /+;Dnmt1fl/fl;Dnmt3afl/fl and PlpcreER(t) /+;Dnmt1fl/fl;Dnmt3afl/fl spinal cords, to detect eventual compensation between DNMTs at the protein level° (p = 0.0075, p = 0.0505, p = 0.0074, p = 0.0053, p = 0.0072, p = 0.0012). Scale bar = 20 µm. Data are mean ± SEM. n = 4–6 animals, three sections per animal. *p < 0.05, **p < 0.01, ***p < 0.001 (Student’s t test).

