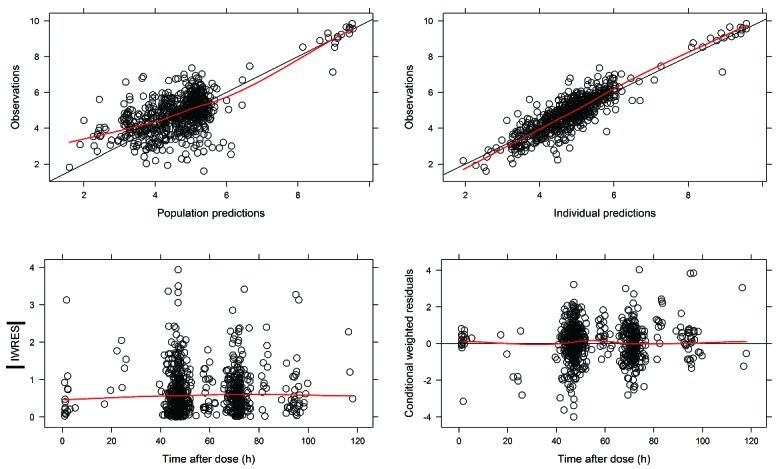
Figure 2.

Goodness-of-fit plots final model. (Upper left) Predicted population concentrations versus observed concentrations of the final model. (Upper right) Predicted individual concentrations versus observed concentrations of the final model. (Lower left) Individual weighted residuals versus individual predictions, (lower right) conditional weighted residuals versus time after dose. h: time in hours; IWRES: individual weighted residual predictions.
