
Figure 1.
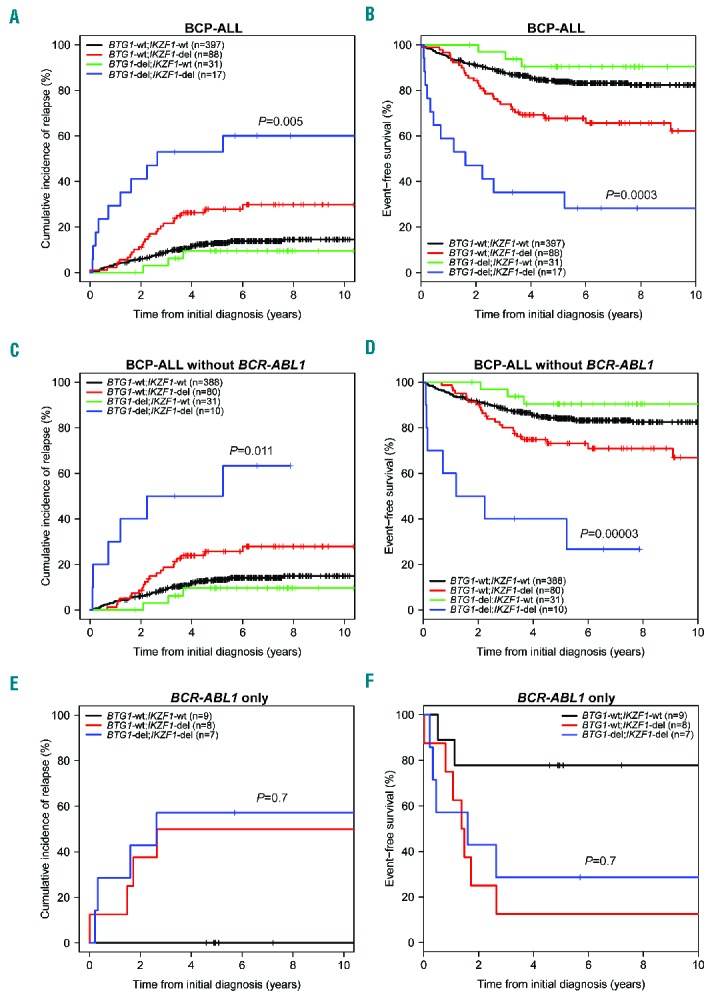
Cumulative incidence of relapse (CIR) and event-free survival (EFS) curves for pediatric BCP-ALL cases with or without IKZF1 and BTG1 deletions. (A) CIR and (B) EFS curves for total BCP-ALL cohort (n=533), IKZF1 plus BTG1 deletion, (C) CIR and (D) EFS curves for BCP-ALL without BCR-ABL1-positive cases (n=509), IKZF1 plus BTG1 deletion, (E) CIR (F) EFS curves for BCR-ABL1-positive cases (n=24), IKZF1 plus BTG1 deletion. Colors: black, IKZF1 and BTG1 wild-type; green, IKZF1 wild-type, BTG1-deleted; red, IKZF1-deleted, BTG1 wild-type; blue, both BTG1- and IKZF1-deleted. For CIR graphs (A,C,E) the Gray P-value and for the EFS graphs (B,D,F) the Cox P-value is indicated comparing BTG1-del;IKZF1-del with BTG1-wt;IKZF1-del. wt: wild-type; del: deletion; n: total number; BCP-ALL: B-cell precursor acute lymphoblastic leukemia.