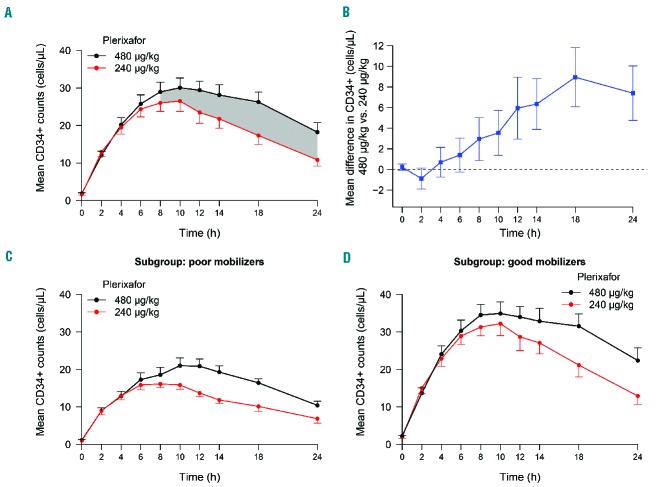
Figure 3.
CD34+ cell counts. (A) Mean CD34+ cell counts in the blood over time with one standard error of the mean (SEM) in all subjects who received both doses of plerixafor. The shaded regions indicate when the mean CD34+ counts were significantly different between the two dose cohorts. (B) Mean paired difference in the CD34+ count following administration of the 480 μg/kg and 240 μg/kg dose with 95% CI. Mean CD34+ cell counts with 1 SEM for (C) poor mobilizers and (D) good mobilizers, defined as those with peak CD34+ counts ≤ 20 cells/μL and > 20 cells/μL after the 240 μg/kg dose of plerixafor, respectively.

