
Figure 1.
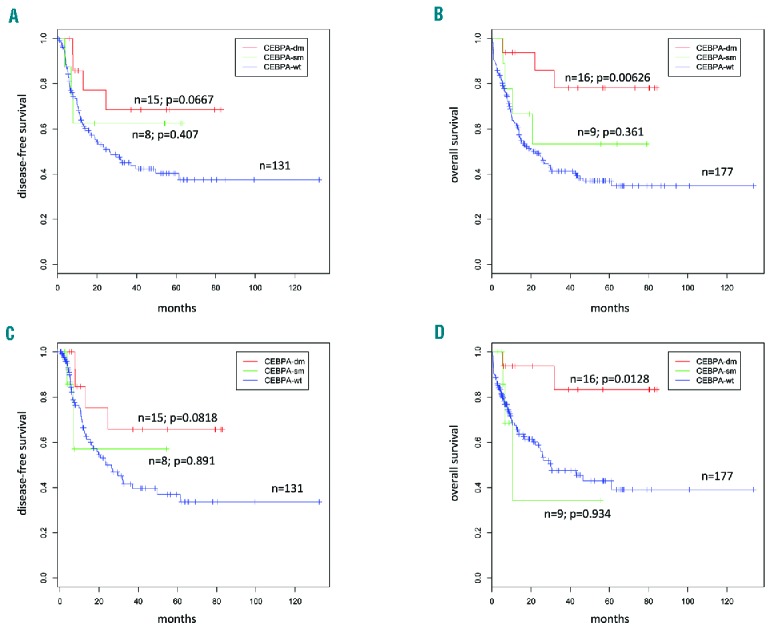
Survival outcomes according to CEBPA gene status. An outcome analysis was carried out for the 202 of 251 patients who were intensively treated. Kaplan Meier curves are stratified on CEBPA status: CEBPA-wild type (blue), single mutants (green), and double mutants (red) with P values representing the comparison versus wild-type patients. (A) Disease-free survival; (B) overall survival; (C) disease-free survival and (D) overall survival after censoring allo-transplanted patients at the date of transplant.