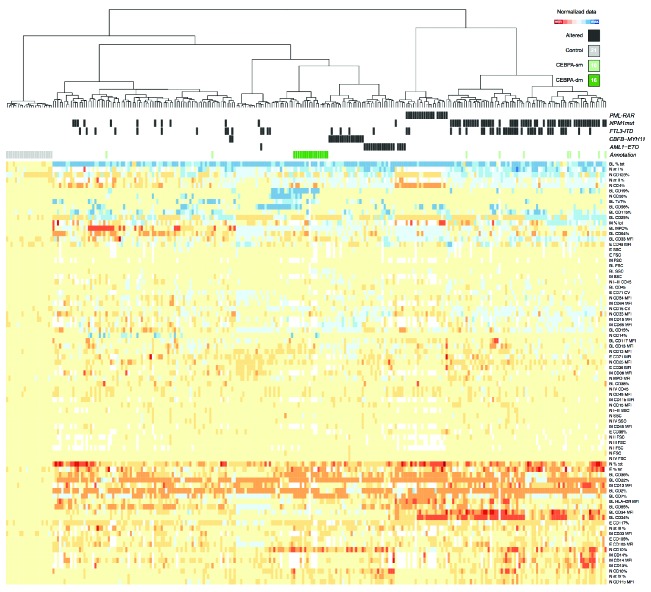
Figure 5.
Unsupervised hierarchical clustering according to genotypic groups. Cluster analysis of controls (n=21) and AML cases (n=251) based on the phenotypic parameters of all bone marrow cell compartments at diagnosis. The CEBPA-double-mutated subset clearly grouped in a separate cluster (dark green in the upper bar). CEBPA-single mutated cases displayed a heterogeneous distribution (light green in the upper bar). Columns represent individual bone marrow samples; rows represent the normalized log2 ratios of each parameter analyzed in a given cell compartment divided by the mean value obtained for that parameter in all control samples. The value of each parameter is represented in a color code according to control values: blue represents expression greater than the mean, red represents expression lower than the mean, white when not available; color intensity represents the magnitude of the deviation from the mean. Cluster analysis was carried out using R software.

