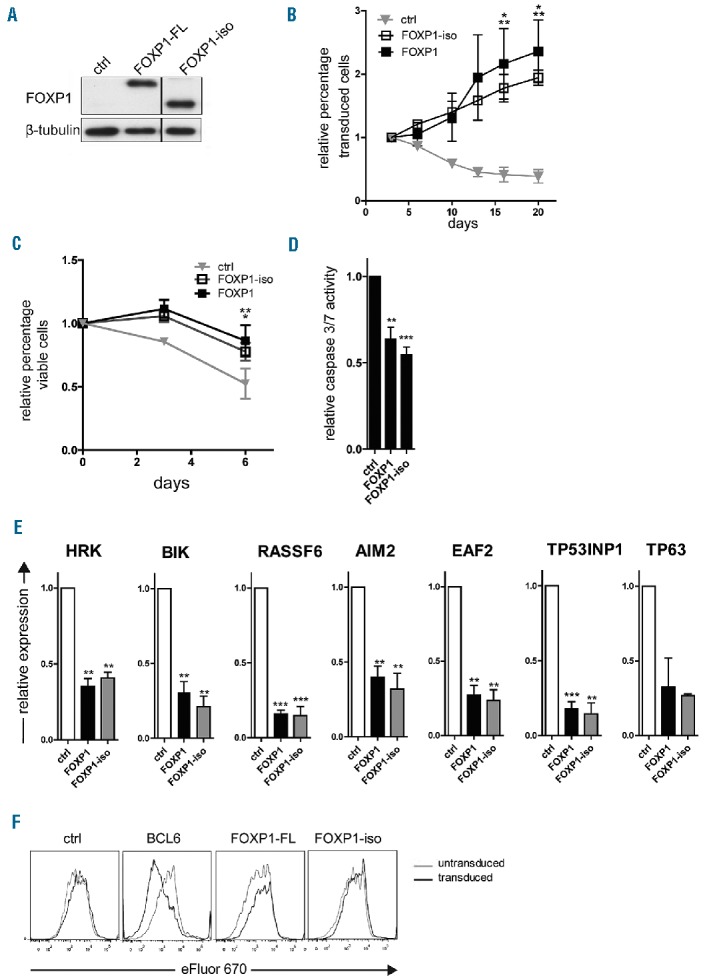
Figure 3.

FOXP1-iso exerts similar effects on B-cell survival as FOXP1-FL. Memory B cells were sorted from human peripheral blood and transduced with either FOXP1-IRES-YFP, FOXP1-iso-IRES-YFP, BCL6-IRES-GFP (F) or ctrl-IRES-YFP, and cultured with CD40L-L cells, IL-21 and IL-2 (A-D,F) or without CD40L-L cells as of day 3 after transduction (E). (A) Representative example of FOXP1 and FOXP1-iso overexpression in primary YFP+ B cells. 6 days after transduction YFP+ cells were sorted and analyzed by immunoblotting. β-tubulin was used as loading control. (B) FOXP1-IRES-YFP, FOXP1-iso-IRES-YFP, and ctrl-IRES-YFP transduced B cells were continuously cultured with IL-21 and IL-2 and CD40L-L cells. The percentage of transduced cells in each culture was followed over time by FACS analysis and normalized to the percentage of transduced cells at day 3 after transduction. Mean ± SD of three independent experiments are shown. Significant differences were observed at day 15 and 20 after transduction between FOXP1 transduced cells vs. ctrl transduced cells (*P<0.05) and between FOXP1-iso transduced and control transduced cells (**P<0.01). (C) A total of 6–7 days after transduction, live YFP positive and negative fractions of FOXP1 and control vector single transduced cultures were sorted. After a recovery period of 4–5 days, the percentage of cells in the FSC/SCC live gate was determined by flow cytometry at three consecutive time points. The data were normalized to the percentage of living cells measured at the first time point. Mean ± SEM of three independent experiments are shown. Significant differences were observed at day 6 after transduction between FOXP1 transduced cells vs. ctrl transduced cells (**P<0.01) and between FOXP1-iso transduced and control transduced cells (*P<0.05). (D) Six days after transduction, the YFP positive fractions of FOXP1-FL, FOXP1-iso, and control vector-transduced cultures were sorted. After a recovery period of 5–7 days, caspase 3/7 activity was determined by the caspase glo3/7 assay. Values were corrected for the number of living cells as determined by FACS analysis. Mean ± SD of five independent experiments are shown (t-test **P<0.01, *** P<0.001). (E) Six days after transduction YFP positive cells were sorted. Gene expression levels of FOXP1 repressed pro-apoptotic genes were analyzed by quantitative RT-PCR. Expression levels were normalized to expression levels in control transduced cells. Mean ± SEM of at least three independent experiments (except for TP63) are shown (one sample t-test, **P<0.01, ***P<0.001). (F) 7 days after transduction, cells were labeled with eFluor 670 and cultured for four days, after which the eFluor 670 intensity was determined by flow cytometry. Representative graphs of two independent experiments are shown. FL: full-length; iso: isoform; ctrl: control.
