
Figure 6. Sensory stimulus evoked responses and pairwise variability are altered in KET and Df(16)A+/− mice.
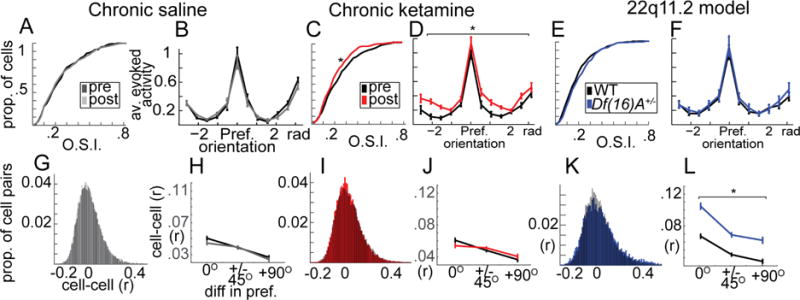
(A) Orientation selectivity (O.S.I) and (B) trial-averaged response curves from visually responsive neurons from saline treated mice (pre vs post, n=631 total cells), (C–D) chronic ketamine treated mice (pre vs post, n=596), (E–F) and Df(16)A+/− mice compared to littermate controls (n=582). (G) Shared variability among neuron pairs across presentations of the same stimulus (“noise correlations”; same cells from A) (H) varied with respect to the orientation preference similarity of neuron pairs and (I–J) was not affected by KET. (K–L) Df(16)A+/− mice, on the other hand, showed an increase in noise correlations among all neuron pairs in the local population regardless of whether they shared stimulus preferences. Line plots reflect average cell responses relative to their preferred stimulus (pre-treatment B,D; within mouse F), and/or including only cells with >.1 O.S.I (H,J,L). (*p<.05; one-way ANOVA; nsal=6, nket=6, ndf16=7, ncontrol=7 mice; Error bars reflect S.E.M across cells/cell-pairs).