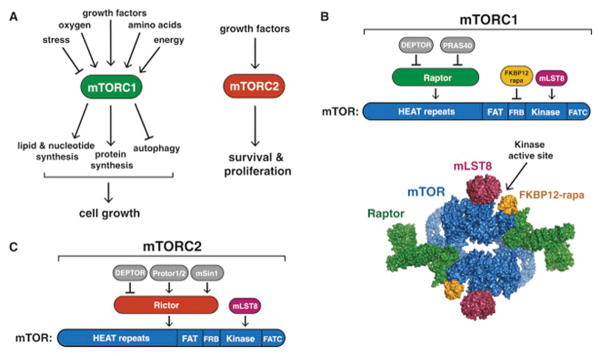
Figure 1. mTORC1 and mTORC2.
(A) The mTORC1 and mTORC2 signaling pathways.
(B) mTORC1 subunits and respective binding sites on mTOR. The FKBP12-rapamycin. The 5.9 Å cryo-EM structure of mTORC1 (without DEPTOR and PRAS40, PDB ID: 5FLC) from is depicted as a space filling model and colored by subunit.
(C) mTORC2 subunits and respective binding sites on mTOR.

