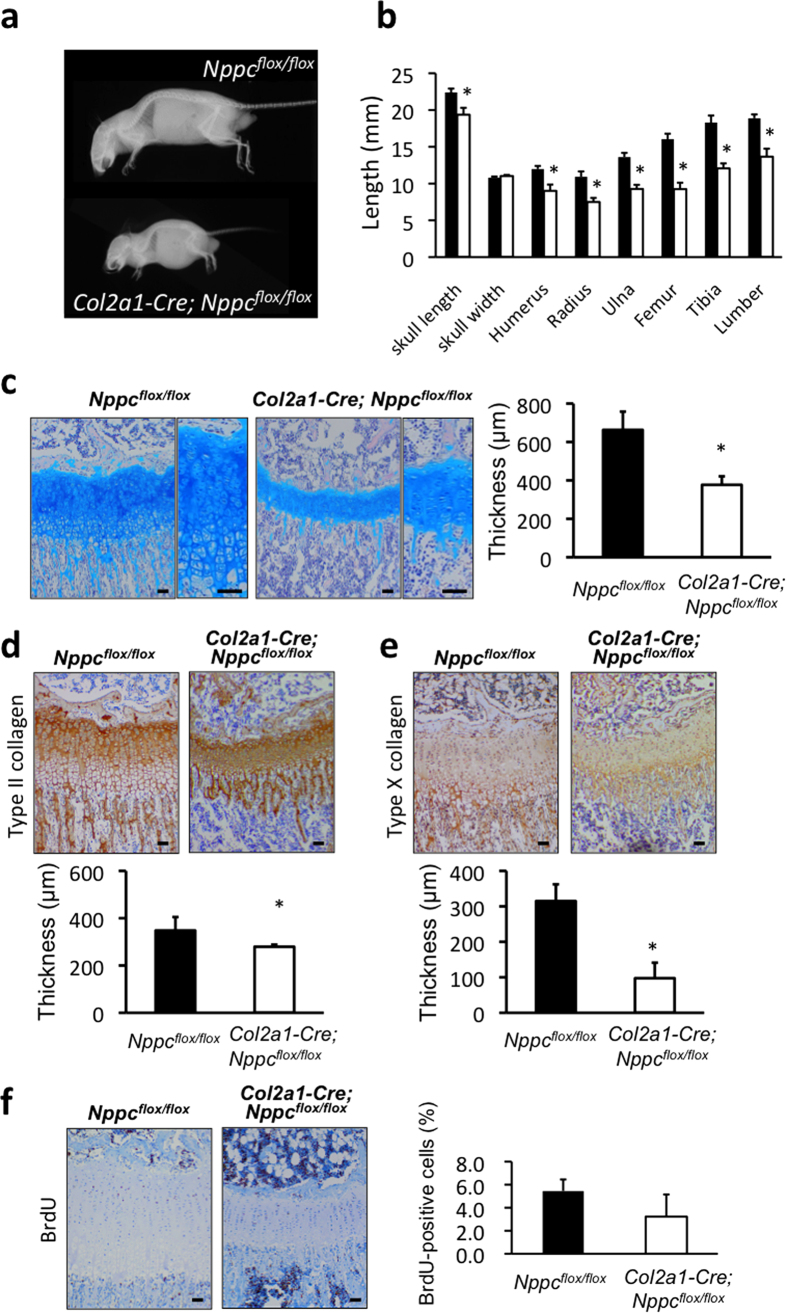
Figure 2. Impaired skeletal growth in Col2a1-Cre; Nppcflox/flox mice.
(a) Soft x-ray picture and (b) morphometric analyses of bones (skull length, skull width, humerus, radius, ulna, femur, tibia, and lumber) of Nppcflox/flox and Col2a1-Cre; Nppcflox/flox mice at the age of 10 weeks. *: P < 0.01, n = 5, each. (c)–(f) Histological analyses of tibial growth plates of Nppcflox/flox and Col2a1-Cre; Nppcflox/flox mice at the age of 2 weeks. Scale bar: 100 μm in each panel. (c) Micrographs of growth plates stained by Alcian Blue-hematoxylin and eosin (left pictures), and the thickness of growth plates (right graph). *: P < 0.01, n = 5, each. In micrographs, right panel in each set of panels is exhibited with higher magnification. (d), (e) Micrographs of tibial growth plates stained by type II (d) and X (e) collagen antibodies (upper pictures), and the thickness of nonhypertrophic (d) and hypertrophic (e) chondrocyte layers of the growth plates (lower graphs). *: P < 0.01, n = 5, each. (f) Micrographs of tibial growth plates with BrdU labeling (left pictures) and the proliferative rate of chondrocytes in growth plate shown as the average percent of BrdU-positive cells relative to total cell count (right graph).

