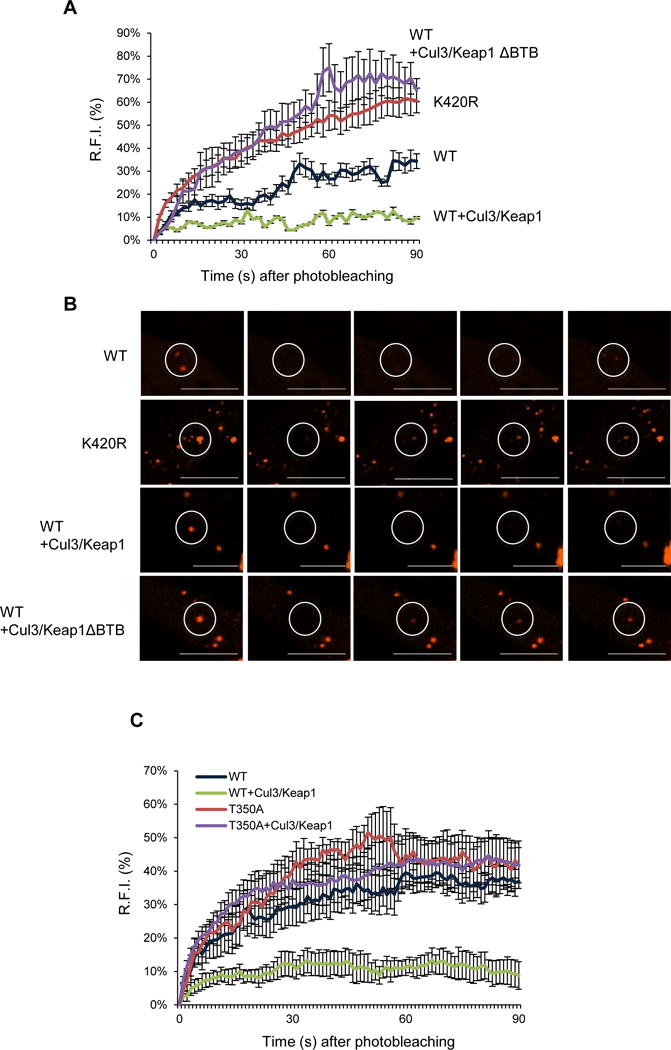
Figure 5. p62 ubiquitination modulates its exchange rate.

(A) The average RFI following photobleaching from p62−/−MEFs expressing mCherry-p62-WT or p62-K420R and V5-Cul3 with myc-Keap1-WT or myc-Keap1-ΔBTB. Representative data is pooled from four independent experiments. (B) Representative live cell images of mCherry-p62-WT or p62-K420R and V5-cul3 with myc-Keap1-WT or myc-Keap1-ΔBTB following photobleaching and fluorescent recovery. The circle indicates the photobleached area. The scale bars indicate 1 μm. (C) The average RFI following photobleaching from p62−/−MEFs expressing mCherry-p62-WT or p62-T350A and V5-Cul3 with myc-Keap1-WT. Representative data is pooled from three independent experiments.
