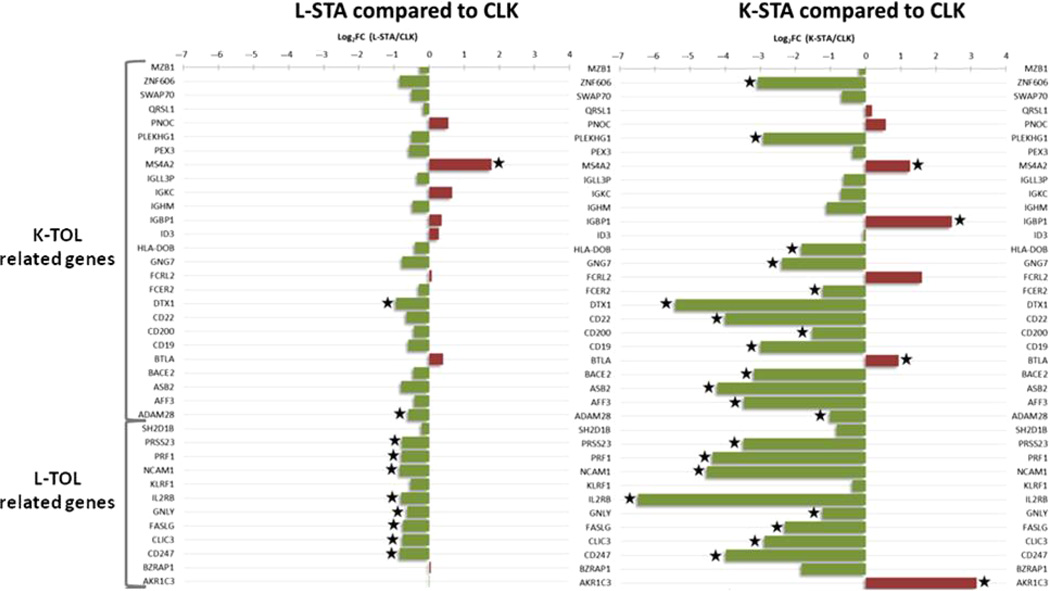
Fig. 3.
mRNA expression profile in CLK. Relative expression of 26 kidney operational tolerance-related transcripts and 12 liver tolerant-related transcripts, in L-STA (left panel) and K-STA (right panel) compared to CLK (Log2 of fold-changes). Green bars indicate an under-expression and red bars an over-expression compared to CLK. Significant differential expressions (P < 0.05) are highlighted with a star.

